Figures & data
Figure 1. Periodicities of the traffic accidents series. (a) Number of accidents depending on day of the week. Weekends present less number of accidents. (b) Number of accidents for each month. August seems to be safer. (c) Number of accidents depending on hour of the day. In this case we have the most clear difference
Figure 2. Total number of accidents by neighborhoods of Madrid during 2018
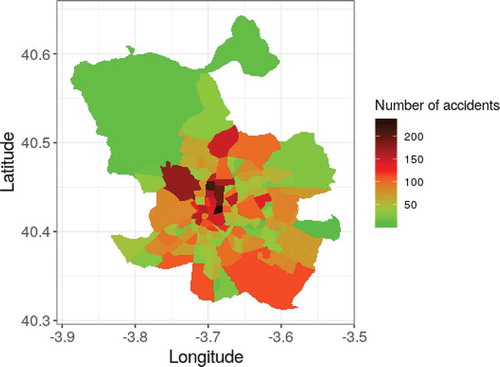
Figure 3. Architecture of the XSTNN model as described in Sect. 4.3
Table 1. Values used for each hyper-parameter. is the dimension of the latent space. The remaining variables were presented in Section 3 or are commonly used parameters
Table 2. Performance for to
traffic accident regression
Figure 4. Forecasting performance (MAE and bias) of the different models by timestep together with the calculated distributions
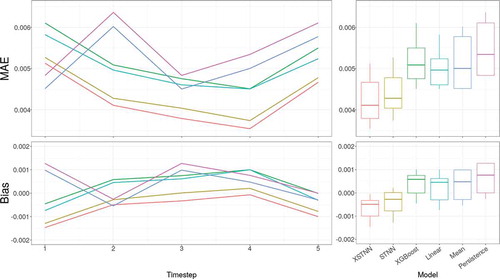
Figure 5. A practical example of the operation of both networks, XSTNN and STNN, for the same situation. From p.m. to
p.m. on a Wednesday
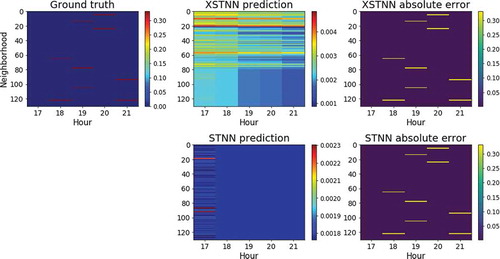
Figure 6. A practical example of the operation of both networks, XSTNN and STNN, for a same situation. From a.m. to
a.m. on a Sunday
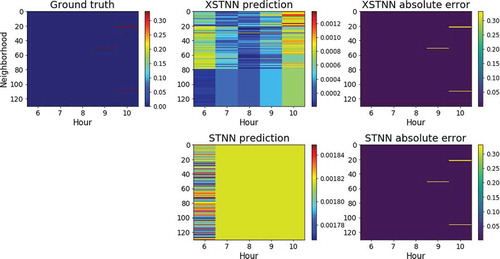
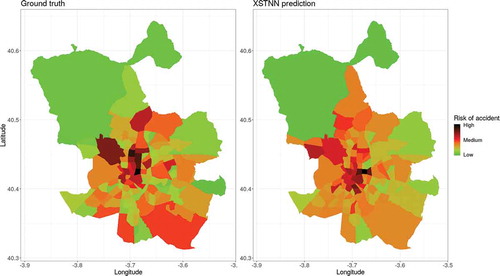
Figure 7. Spatial risk in the same scale for the ground truth (left) and the XSTNN (right)