Figures & data
Figure 1. Sample raw images from street and road cameras representing (a) Dry (b) Offline, (c) Poor, (d) Snow and (e) Wet categories
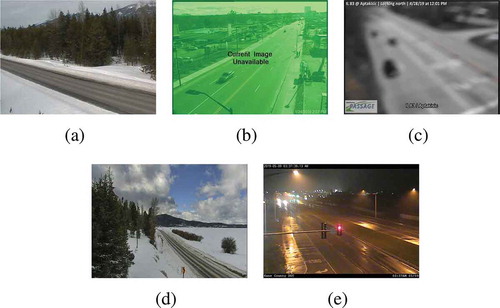
Figure 2. A summary of near real-time road condition classification process
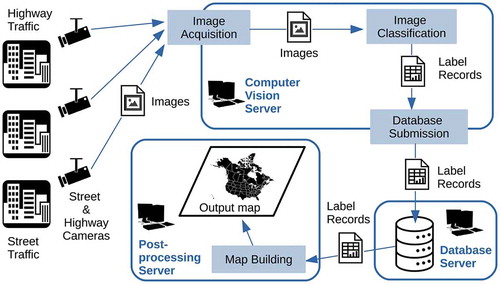
Figure 3. An overview of the data preparation and experimentation phases
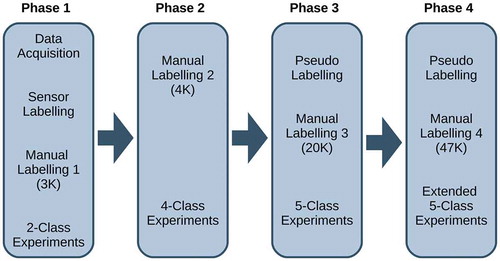
Figure 4. Augmented data samples
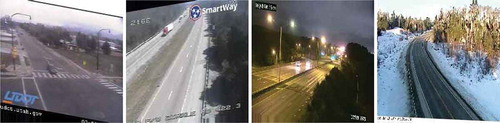
Table 1. Labeling of images by road condition sensors located near the cameras
Table 2. Phase 1 classification metrics and the confusion matrix for ResNet-50 (top) and VGG-16 (bottom) frameworks
Table 3. Phase 2 classification metrics and the confusion matrix for VGG-16 framework
Table 4. Phase 3 classification metrics and the confusion matrix for VGG-16 framework
Table 5. Classification judgment for 1000 random images from combined (1.5 M) data sets
Table 6. VGG-16 pseudo-labeling results the 352 K and 1.1 M data sets
Table 7. Final 47 K labeled data set with 5 classes
Table 8. Phase 4 classification metrics and the confusion matrix for VGG-16 framework
Table 9. Phase 4 classification metrics and the confusion matrix for inceptionResNetV2 framework
Table 10. Phase 4 classification metrics and the confusion matrix for efficientNet-B4 framework
Table 11. Summary of classification judgments for 1000 random images from the combined (1.5 M) data set
Table 12. Common configurations
Table 13. Algorithm-specific configurations. H: Hidden. D: Dropout
Figure 5. Training accuracy (left) & validation accuracy (right) over 12 epochs for 6 algorithms
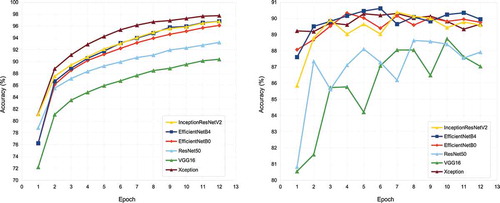
Figure 6. Execution times (training + validation + model saving) over 12 epochs for 6 algorithms. Left: Per epoch. Right: Cumulative
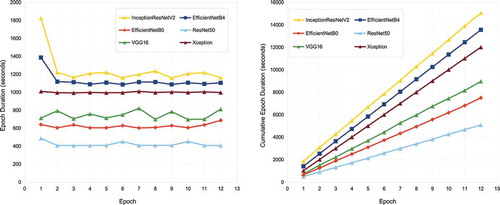
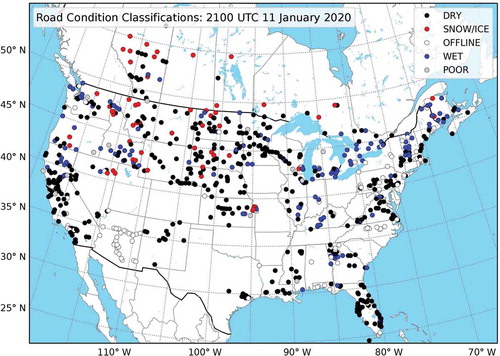
Table 14. Classification judgment for the 782 images captured real-time in Canada and the United States at 2100 UTC 11 January 2020
Figure 7. An example map of 782 classified camera images over Canada and the United States at 2100 UTC 11 January 2020. Each marker represents one classified image with the legend indicating the color corresponding to each respective class