
Figures & data
Table 1. Data statistics of the study
Figure 1. The flowchart of the study
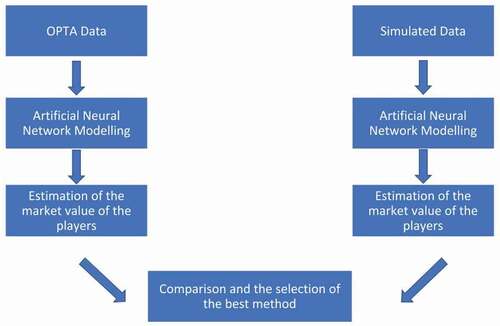
Figure 2. ANN structure of the study
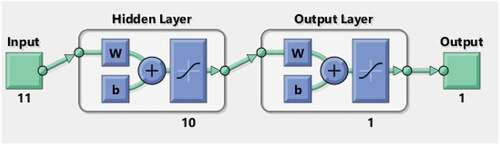
Table 2. The backpropagation used in the study
Table 3. The optimization of the number of hidden neurons for simulated data (data was not normalized)
Table 4. The optimization of percentages of training, validation and testing for simulated data (data was not normalized)
Table 5. The comparative performance results of backpropagation algorithms for the simulated data (data was not normalized)
Table 6. The comparison of ANN estimated market values with the market values from OPTA (Values are given in Euro)
Table 7. The market values and the performance parameters of the players in the with mean values
Supplemental material