
Figures & data
Figure 1. Tuta absoluta’s life cycle and its damage to tomatoes. (a) Four stages of T. absoluta’s life cycle. (b) Tomato leaf with T. absoluta mines. (c) Severe damage on tomato field. (d) Damaged tomato fruits in the field. (e) Damaged tomato fruit on the market
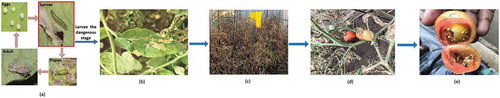
Figure 2. Experimental setup in a field. (a) A nethouse. (b) Researcher and an agricultural expert performing infestation in Arusha and Morogoro fields
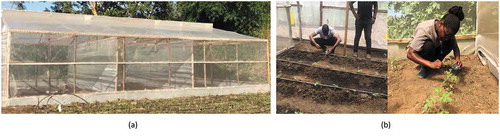
Figure 3. Some images from our dataset showing the development of tuta mines on different days
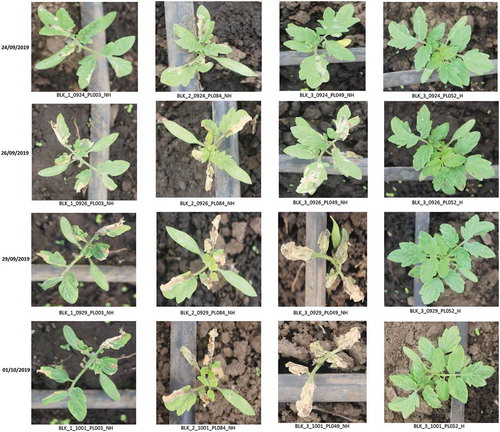
Table 1. Dataset distribution
Figure 4. Research conceptual framework
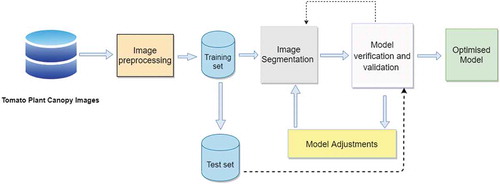
Table 2. Train/test set splits
Figure 5. U-Net architecture
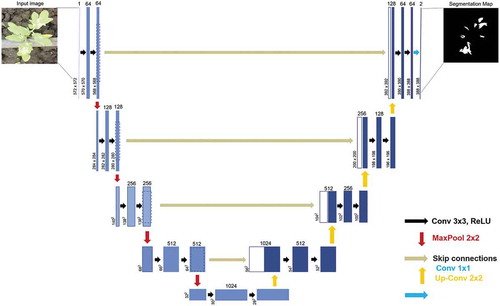
Figure 6. Proposed Mask RCNN model architecture
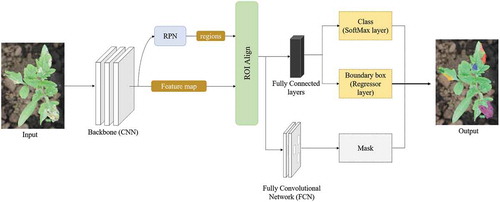
Figure 7. Augmented images with their corresponding annotations
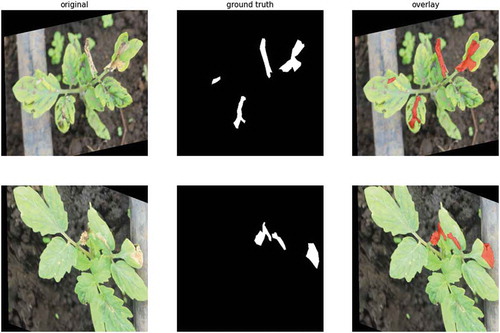
Table 3. Training time
Figure 8. Training and validation loss curve for Mask RCNN. Loss graph for (a) Mask RCNN-ResNet50, (b) Mask RCNN-ResNet101, (c) Mask RCNN-Resnet50 with augmentations, and (d) Mask RCNN-Resnet101 with augmentations
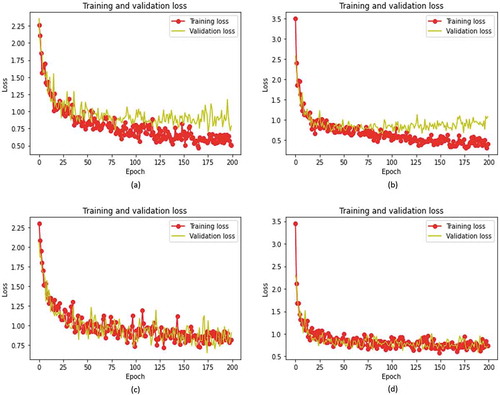
Figure 9. Training and validation loss curve for U-Net
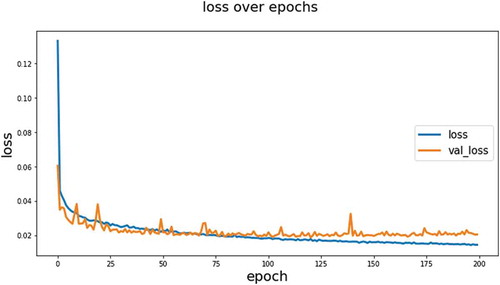
Figure 10. The evaluation metrics results for the semantic segmentation model. (a) IoU for U-Net. (b) Dice Coefficient for U-Net
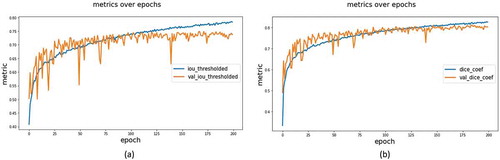
Figure 11. Examples of segmentations carried out by the proposed U-Net model
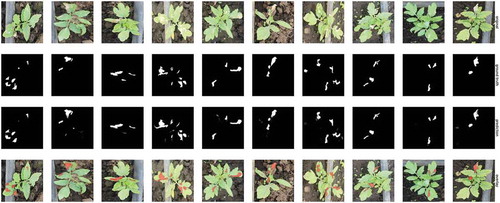
Figure 12. The Precision-Recall Curve
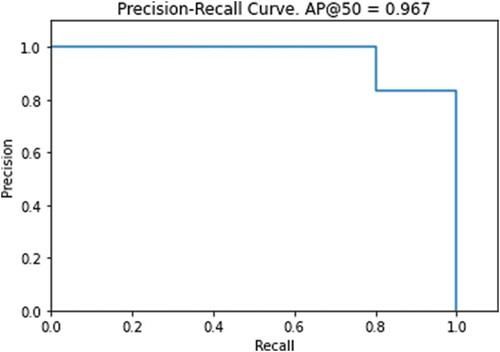
Figure 13. Examples of segmentations carried out by the proposed Mask RCNN model
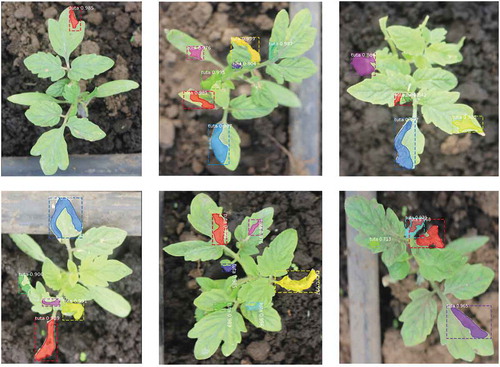
Table 4. The mAP (primary metric) values of the tomato images obtained by different detection methods