Figures & data
Figure 1. Valve point loading effect.
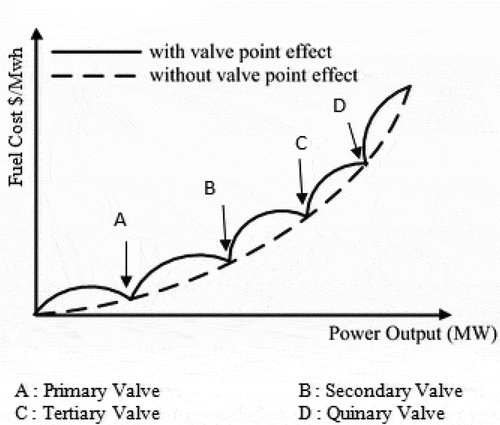
Table 1. Penalty factor calculation
Table 2. The parameter for the OWP-based OMF algorithm
Table 3. Best achieved solutions for test system I: 6 generators ()
Table 4. Comparison of the minimum FC in ELD, minimum E in EMD, and minimum TC in CEED obtained by difirent algorithms for test system I: 6 generators
Figure 2. Comparison of the results for .
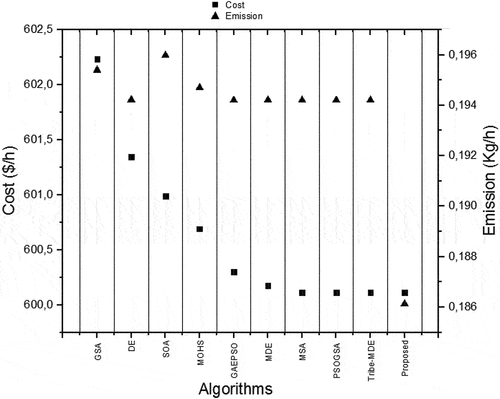
Figure 3. Ranking of OWP-based OMF and the compared algorithms by the Friedman’s test on test system I.
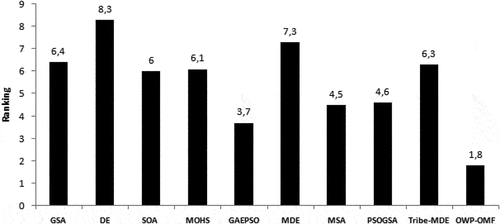
Figure 4. Ranking of OWP-based OMF and the compared algorithms by the Quade’s test on test system I.
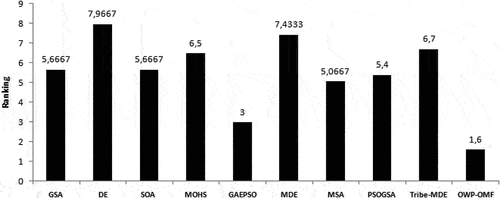
Table 5. Statistical results obtained over 30 runs with OWP-based OMF for test system 1
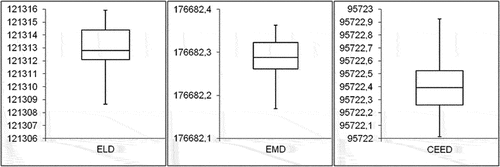
Figure 5. Box plot-distributed results for ELD, EMD and CEED problems for test system I.
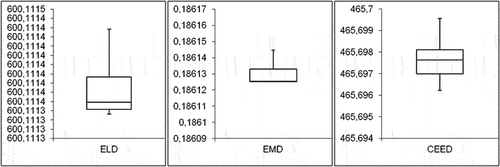
Table 6. Best achieved solutions for test system II: 10 generators ()
Table 7. Comparison of the minimum FC in ELD, minimum E in EMD, and minimum TC in CEED obtained by difirent algorithms for test system II: 10 generators
Figure 6. Comparison of the results for .
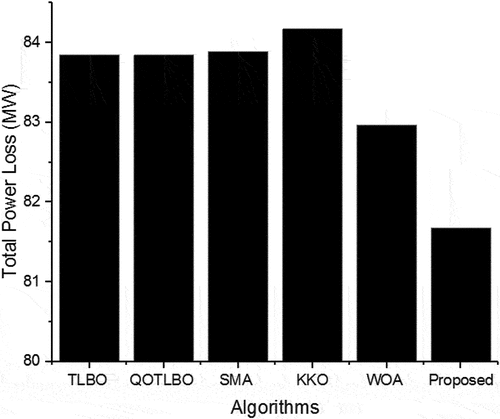
Figure 7. Ranking of OWP-OMF and the compared algorithms by the Friedman’s test on test system II.
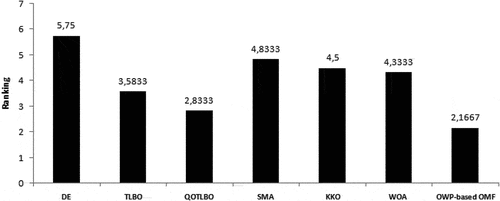
Figure 8. Ranking of OWP-OMF and the compared algorithms by the Quade’s test on test system II.
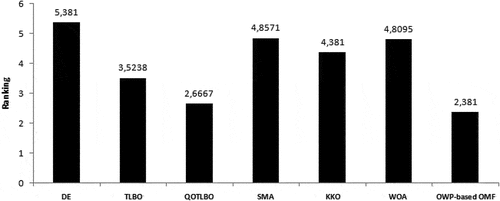
Table 8. Statistical results obtained over 30 runs with OWP-based OMF for test system 2
Figure 9. Box plot-distributed results for ELD, EMD and CEED problems for test system II.
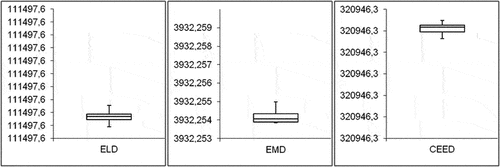
Table 9. Best achieved solutions for test system III: 40 generators ()
Table 10. Comparison of the minimum FC in ELD, minimum E in EMD, and minimum TC in CEED obtained by difirent algorithms for test system III: 40 generators
Figure 10. Comparison of the results for .
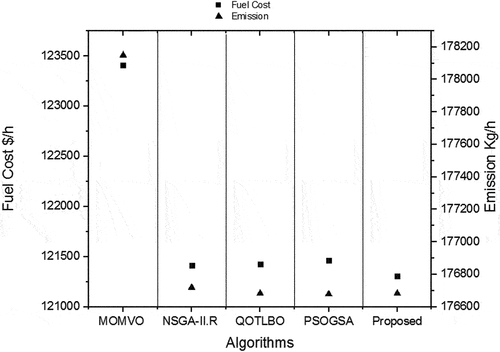
Figure 11. Ranking of OWP-OMF and the compared algorithms by the Friedman’s test on test system III.
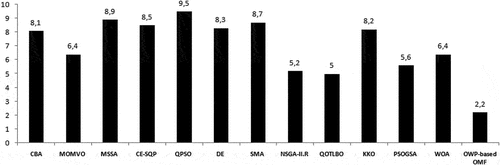
Figure 12. Ranking of OWP-OMF and the compared algorithms by the Quade’s test on test system III.
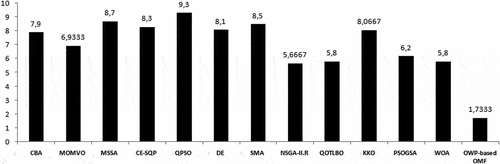
Table 11. Statistical results obtained over 30 runs with OWP-based OMF for test system 3
Figure 13. Box plot evaluation for ELD, EMD and CEED problems for test system III.