Figures & data
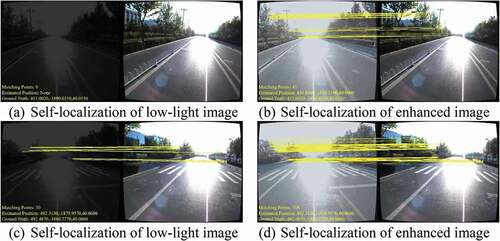
Figure 1. Comparison of matching results and detection results between low-light image and the enhanced image obtained by our method.
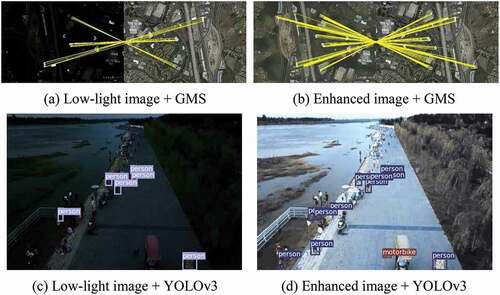
Figure 2. The proposed low-light image enhancement pipeline. The Decom-Net decomposes the input image into an illumination map and reflectance map, and the Enhance-Net brightens up the illumination map. The reflectance map and illumination map of the low-light image are used as the input of Enhance-Net. The decompositions of normal-light images do not participate in the Enhance-Net training stage.
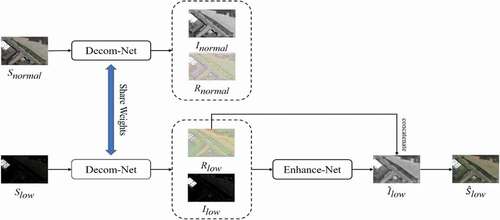
Figure 3. The network architecture of Decom-Net.
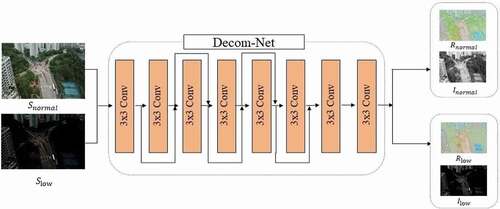
Figure 4. The network architecture of Enhance-Net.
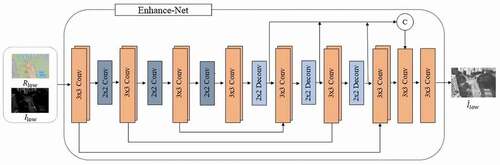
Figure 5. Example of the low-light image decomposition result. (a) is the input image, (b) is the reflectance map generated by Decom-Net, (c) is the illumination map generated by Enhance-Net.
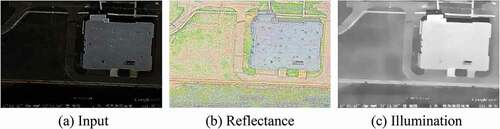
Figure 6. Example of synthetic low-light image.
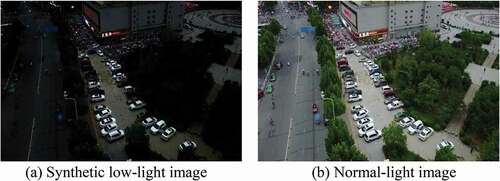
Figure 7. The Laplacian gradient function values of images under different illumination conditions.
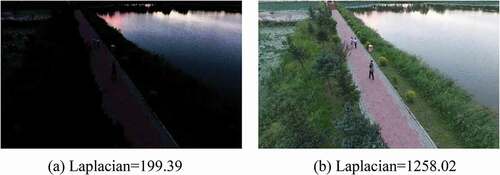
Figure 8. Visual navigation pipeline.
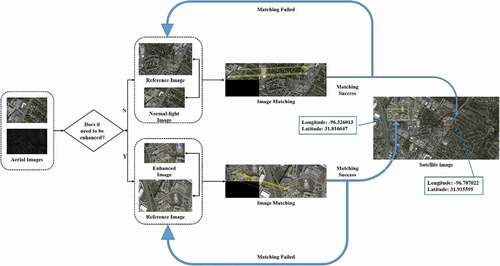
Table 1. PSNR/SSIM values on the synthetic test images. Note that the red, blue, and green in the table represent the best, sub-optimal, third-place results, respectively
Figure 9. Visual comparison of the synthetic test images. Please zoom in for a better view.
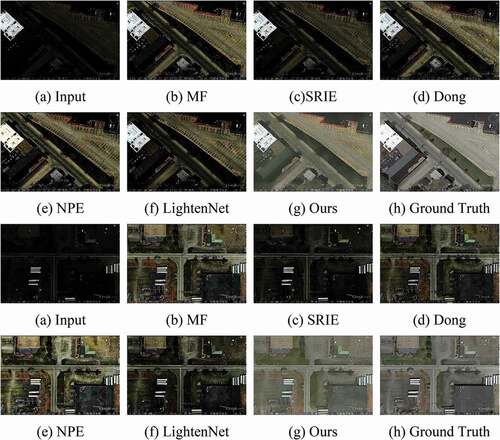
Table 2. Comparison of matching results on the synthetic test images
Figure 10. Experimental results of visual navigation.
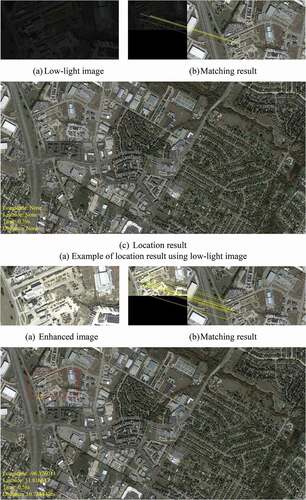

Table 3. Self-localization accuracy and average matching points of the autonomous driving experiment
Figure 11. Experimental results of autonomous driving.