Figures & data
Figure 1. The basic structure of GAN.
Table 1. The confusion matrix
Figure 2. Model evaluation – KS diagram and ROC diagram.
Figure 3. Flow chart of model construction.
Table 2. The influencing variable
Figure 4. The distribution of the amplified data is consistent with the original data.
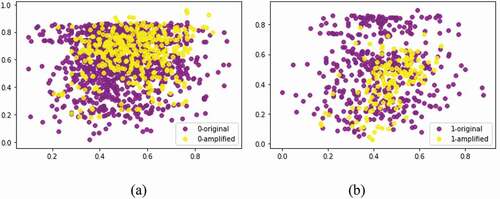
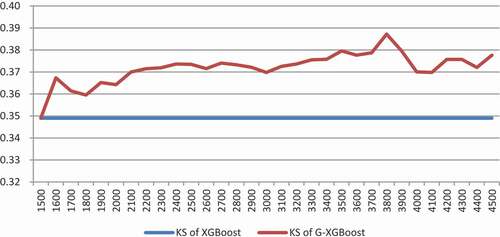
Figure 5. KS under different amplified sample thresholds.
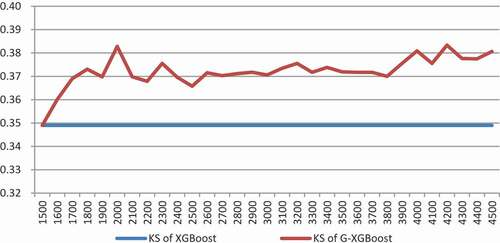
Figure 6. AUC under different amplified sample thresholds.
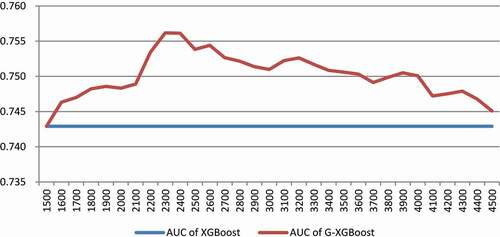
Table 3. The KS and AUC value of different model
Table 4. The statistics of Model 1 validation sets
Figure 7. The prediction effect of Model 1 validation sets.
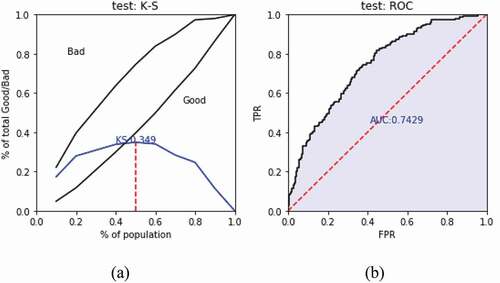
Table 5. The statistics of Model 2 validation sets
Figure 8. The prediction effect of Model 2 validation sets.

Figure 9. KS under only using bad samples to amplify the sample set.