
Figures & data
Figure 1. Demonstration of images in specular highlight removal. Top: highlight images, bottom: diffuse images. We need to restore the diffuse image from the highlight image.
Figure 2. The image-to-image translation in specular highlight removal. The left is the highlight domain, and the right is the diffuse domain.
Figure 3. The overall structure of our network. The generator consists of an attention module and autoencoder with skip connections. The discriminator is formed by a series of convolution layers.
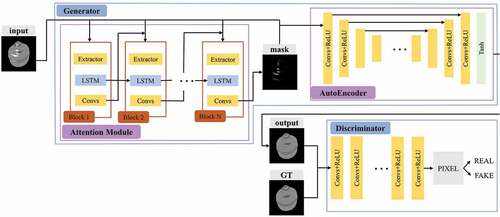
Figure 4. Sample of highlight intensity mask. From left to right are highlight image, highlight intensity mask, and diffuse image which is ground truth.
Figure 5. The internal structure of a recursive block in the attention module.
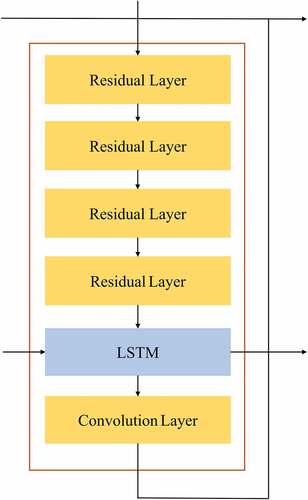
Figure 6. Two choices for the architecture of the autoencoder.
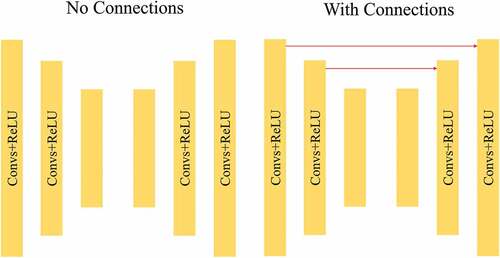
Figure 7. The structure of the pixel discriminator. Conv2D (a, b) means the input channel of the convolution layer is a, and the output channel is b.
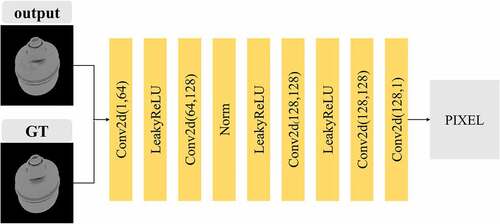
Figure 8. Samples from highlight dataset with 5 different view angles. The top row is highlight images, and the bottom row is diffuse images.
Figure 9. The learning curve of SSIM loss and MSE loss.
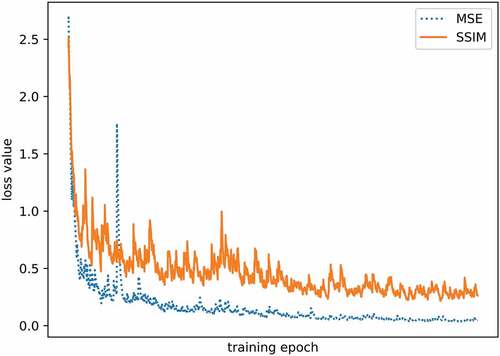
Figure 10. Visualization of the highlight intensity mask generated by our attention module at different training steps.
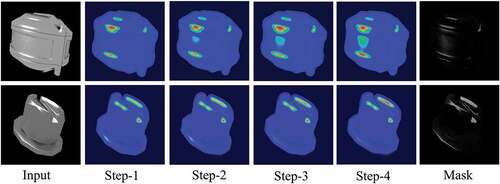
Table 1. The quantitative evaluation result of all test images
Figure 11. Comparison of 5 test cases of different GAN models in specular highlight removal.
Figure 12. A close look at the comparison between outputs in case (5).
Table 2. The quantitative evaluation result of cases study