
Figures & data
Table 1. Physiological parameters with wearable devices
Figure 1. MTDS block diagram.
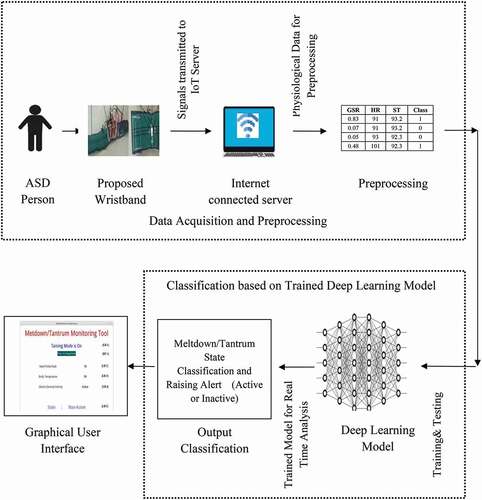
Figure 2. (a) Specially designed hardware wristband prototype. (b) Specially designed hardware wristband connectivity diagram.
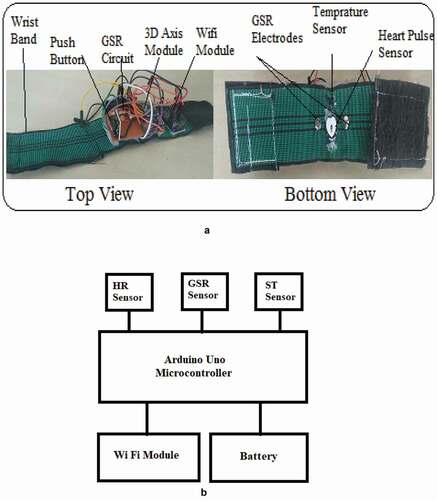
Figure 3. CNN-LSTM architecture for the proposed system.
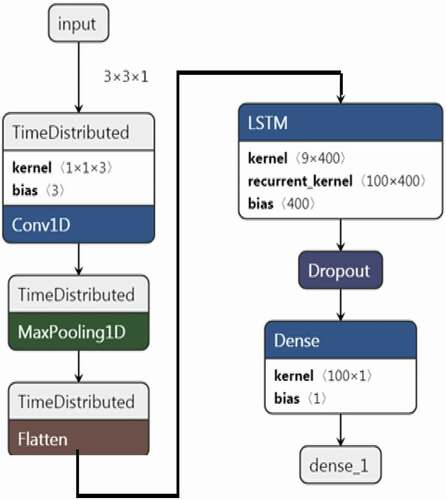
Figure 4. Proposed work flow diagram of the proposed MTDS. (a) Proposed work flow of CNN-LSTM training and testing. (b) Proposed Work flow of CNN-LSTM validation.
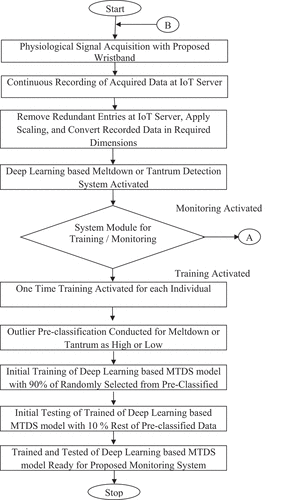
Figure 4. Continued.
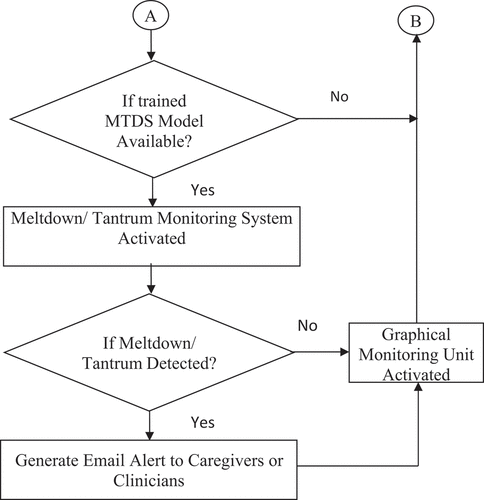
Figure 5. Procedure for data acquisition and pre-classification.
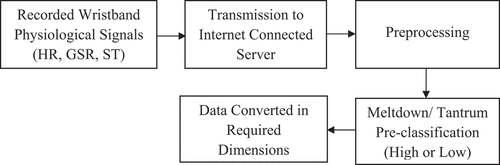
Figure 6. Procedure for training and testing of the deep learning algorithm.
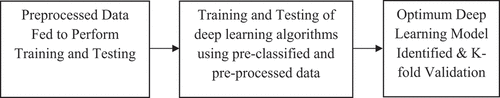
Figure 7. Procedure for meltdown or tantrum detection and alerting.
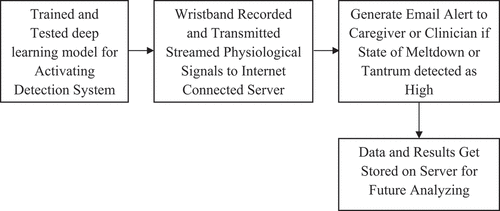
Figure 8. Procedure for monitoring of meltdown or tantrum state.
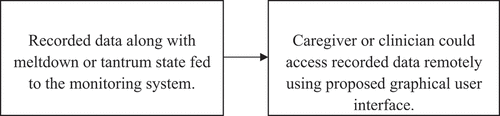
Table 2. Training accuracy of CNN-LSTM vs. LSTM vs. CNN
Table 3. Testing accuracy of CNN-LSTM vs. LSTM vs. CNN
Figure 9. Training accuracy of CNN-LSTM vs. LSTM vs. CNN.
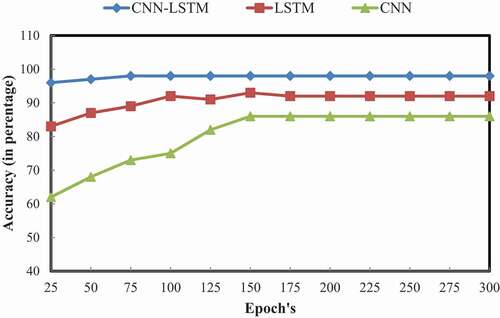
Figure 10. Testing accuracy of CNN-LSTM vs. LSTM vs. CNN.
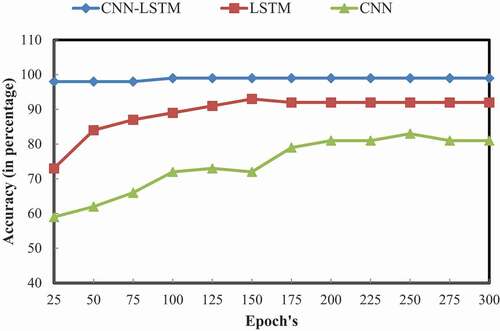
Figure 11. MTDS training and testing accuracy.
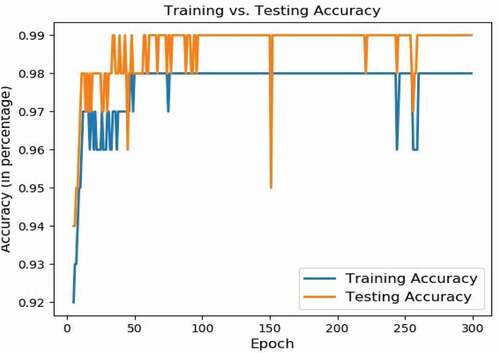
Figure 12. MTDS training and testing MAE.
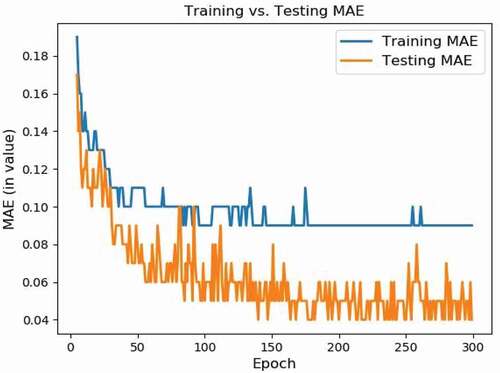
Figure 13. MTDS recall.
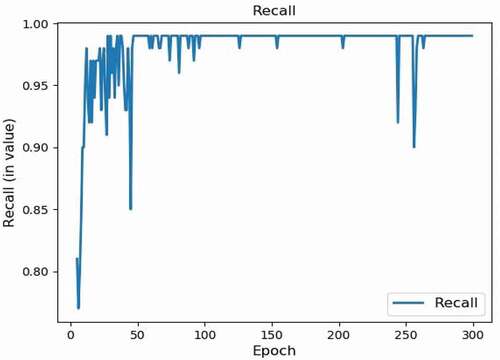
Figure 14. MTDS precision.
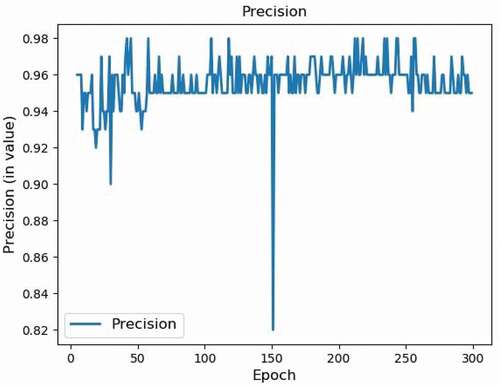
Figure 15. MTDS F1-score.
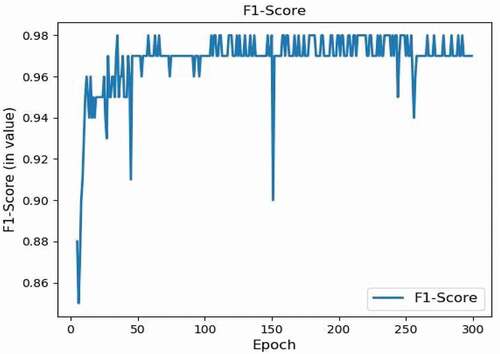
Table 4. Average of K-fold cross-validation of MTDS
Figure 16. Average of K-fold cross-validation of MTDS.
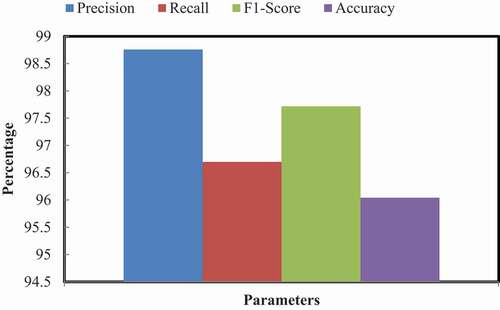
Table 5. Caregiver’s responses for the proposed system
Figure 17. Responses of related caregivers for defined parameters and their overall mean.
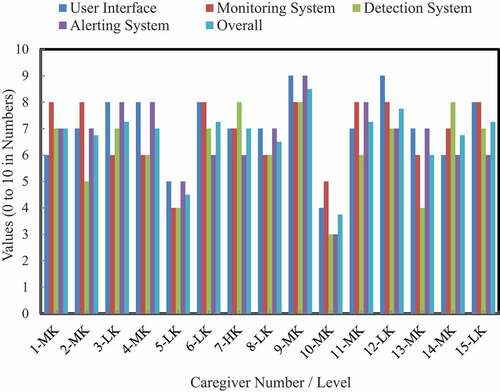
Table 6. Statistical analysis based on caregiver’s responses
Table 7. Comparative analysis of the proposed system and available technologies/systems