
Figures & data
Figure 1. Spatial variation of observed (a) and predicted (b) LST for May.
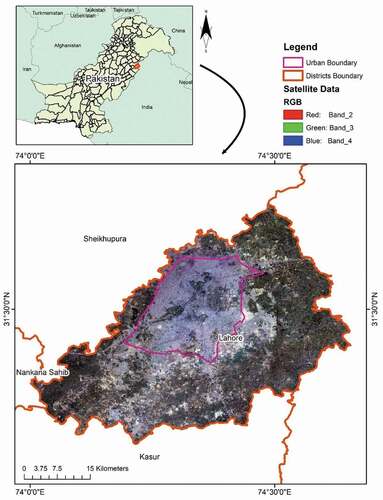
Figure 2. Study area map.
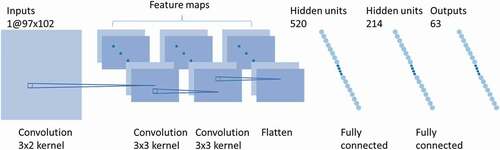
Figure 3. CNN network structure.
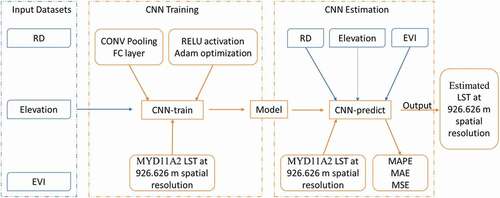
Figure 4. (a) and (b) CNN model methodology.
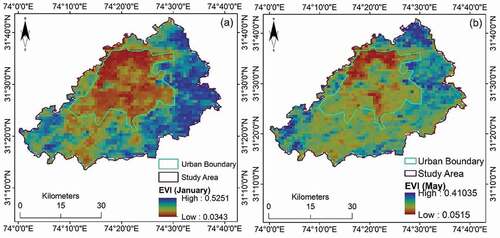
Figure 5. EVI images of the Lahore district of January (a) and May (b) of 2019.
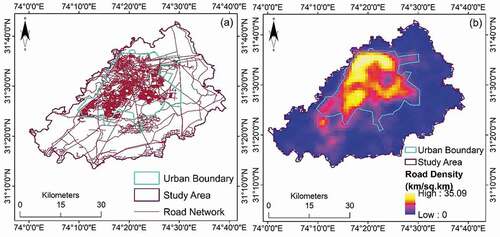
Figure 6. Road network map (a) and road density (b) of the Lahore district.
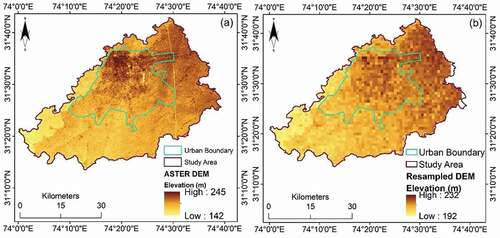
Figure 7. Downloaded ASTER DEM (a) and resampled DEM (b) of the Lahore district.
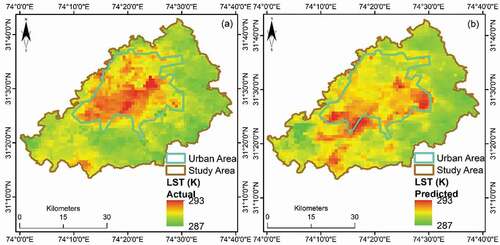
Figure 8. Spatial variation of observed (a) and predicted (b) LST for January.
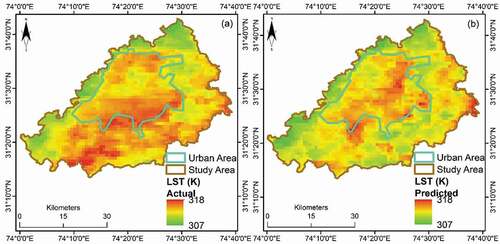
Figure 9. Difference among observed and model-predicted LST for January (009–016).
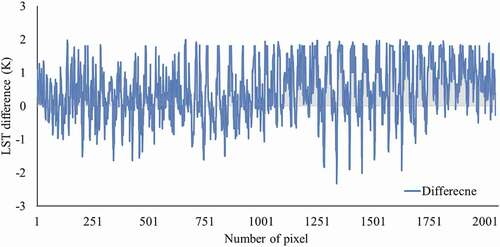
Figure 10. Difference among observed and model-predicted LST for May (137–144).
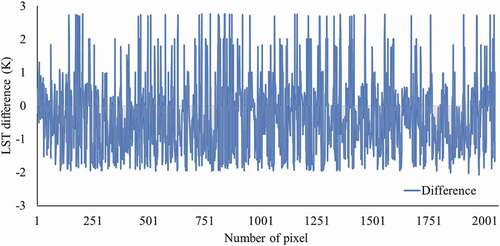
Figure 11. Spatial variation of error between the observed and predicted LST for January (a) and May (b).
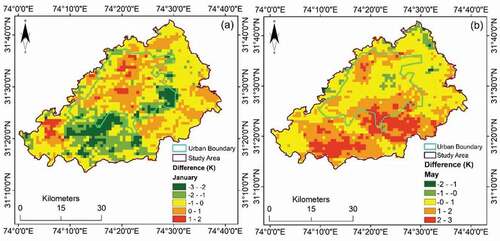
Table 1. Used remote sensing data for this study
Table 2. Accuracy of different model types
Table 3. Comparison of maximum, minimum, and mean actual and predicted LST values for 2020
Table 4. MAE, MAPE, and MSE for both periods
Table 5. Number of pixels (% of pixels) of the Lahore district in different error ranges