Figures & data
Figure 1. The pseudo-code for the proposed IGACO algorithm.
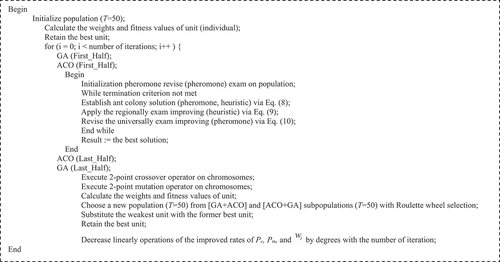
Figure 2. Illustrative schema of the unit matrix.
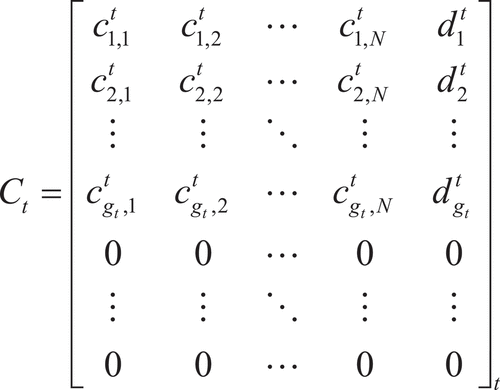
Figure 3. The design of decoding convention for the matrix form.
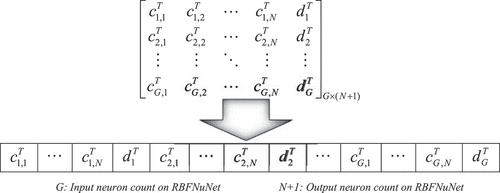
Figure 4. Illustrative schema of two-point crossover between and
through each pair of rows individually alternating their values with Pc.
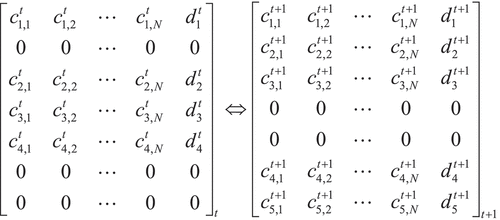
Table 1. The parameters setting for several benchmark problems in the experiment
Table 2. Parameter values setting for the IGACO algorithm
Table 3. Result comparison among relevant algorithms employed in this experiment
Table 4. Contrast of the best learning expression among relevant algorithms in the experiment
Table 5. Comparison of the time consumed (in seconds) among relevant algorithms arriving at the preset RMSE threshold
Table 6. The data period of the spot gold price forecast exercise
Table 7. Parameters setup for the IGACO algorithm in the spot gold price forecast exercise
Table 8. The forecasting errors comparison for relevant algorithms used in the spot gold price forecast exercise
Table 9. The statistical results for T-test among relevant algorithms
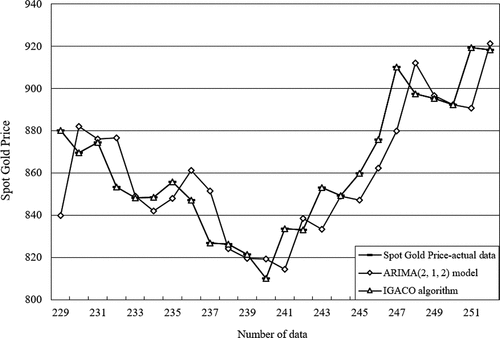
Figure 5. The forecasting results comparison of the proposed IGACO algorithm and Box-Jenkins model for the spot gold price forecast exercise.