Figures & data
Figure 1. Proposed system architecture for leukemia detection.
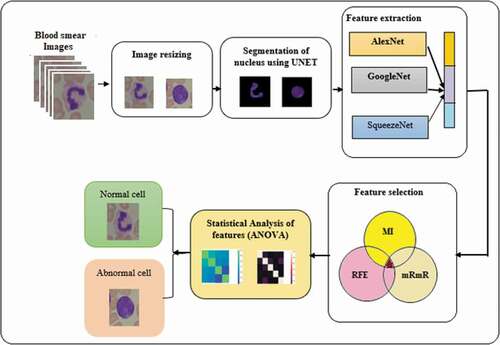
Figure 2. Architecture of U-Net for segmentation of WBC nucleus.
Figure 3. Typical microscopic images: (a) healthy cells and (b) blast cells.
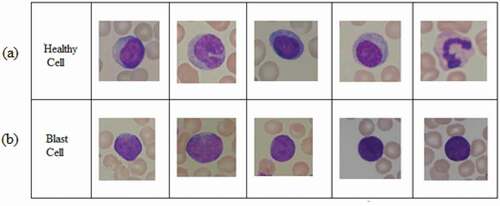
Figure 4. Segmentation of nucleus by U-Net: (a) healthy cells and (b) blast cells.
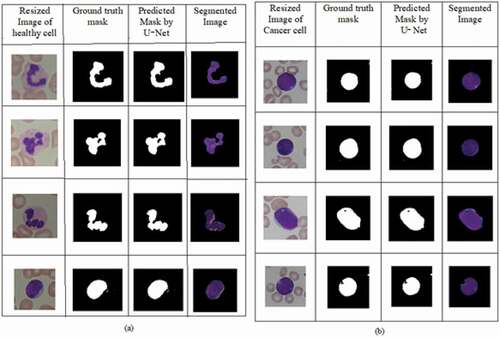
Figure 5. Performance of U-Net based segmentation.
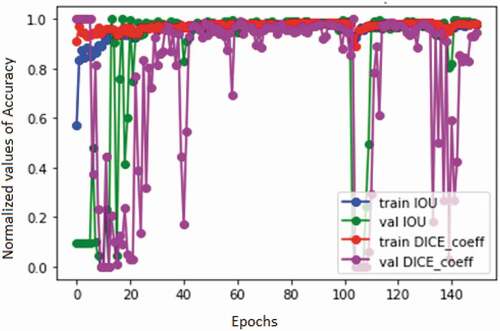
Figure 6. Heat map of fused features: (a) healthy cells and (b) blast cells.
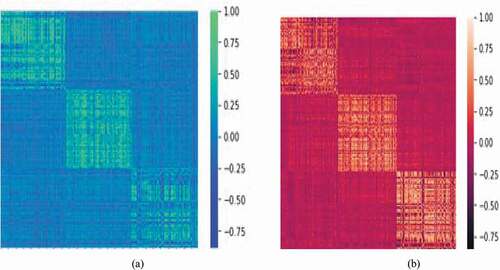
Figure 7. Heat map representation of selected features for healthy cells and blast cells: (a) MI (mutual information), (b) mRmR (minimum recursive maximal relevance) and (c) RFE (recursive feature elimination) based methods.
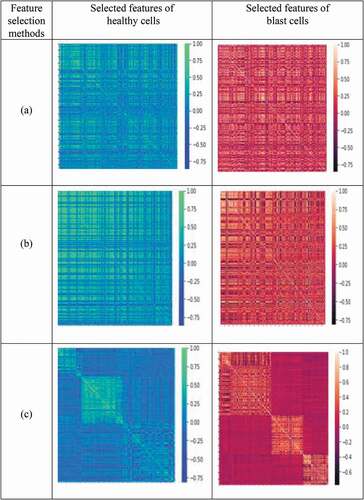
Figure 8. Heat map of 50% intersected features: (a) healthy cells and (b) blast cells.
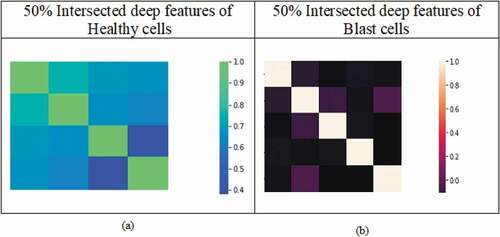
Table 1. Significance of features using ANOVA test
Table 2. Performance analysis of the proposed system with other recent deep learning networks
Table 3. Performance comparison of the proposed method with other existing methods using the ALL–IDB2 dataset
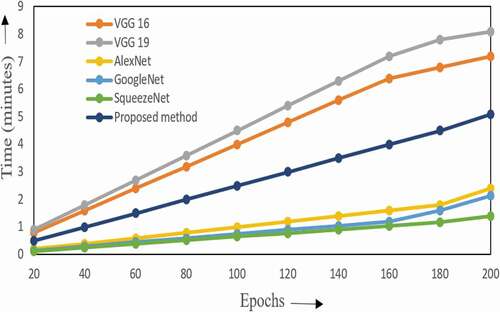
Figure 9. Variation in computational complexity vs different epochs for considered methods.