
Figures & data
Figure 1. Process.
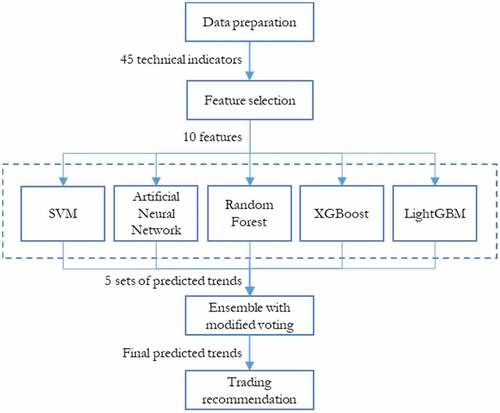
Table 1. Technical indicators used
Figure 2. Determining classd from δd.
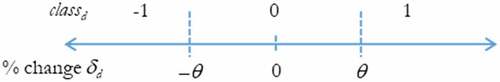
Table 2. Final decision of trend prediction results
Figure 3. Trading recommendation based on classd.
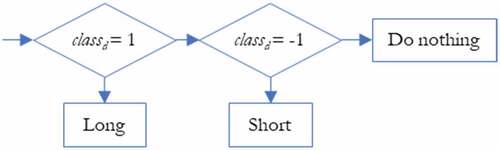
Figure 4. Algorithm for trading recommendation.
Table 3. Characteristics of stocks used in the experiment
Figure 5. Price charts of all stocks in dataset A (2014–2018). Training and testing datasets are shown in green and blue colors.
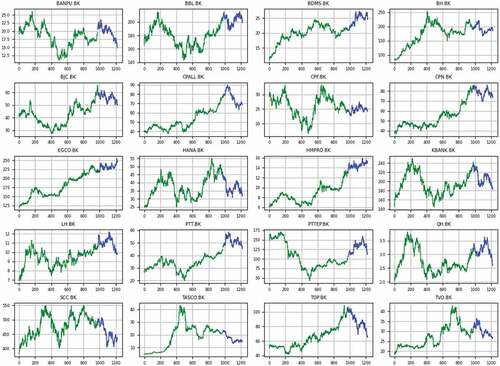
Figure 6. Price charts of all stocks in dataset B (2015–2019). Training and testing datasets are shown in green and blue colors.
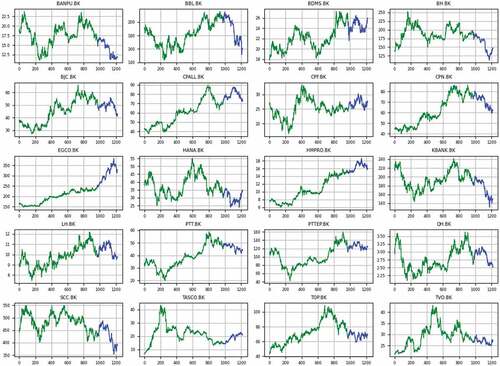
Figure 7. Price charts of all stocks in dataset C (2016–2020). Training and testing datasets are shown in green and blue colors.
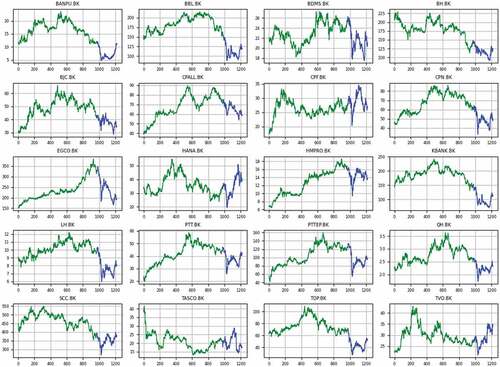
Figure 8. Proportions of % price changes.
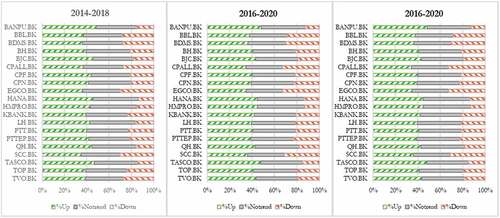
Table 4. Results of accuracy values and returns of trading
Figure 9. Comparative returns for some largest stocks.
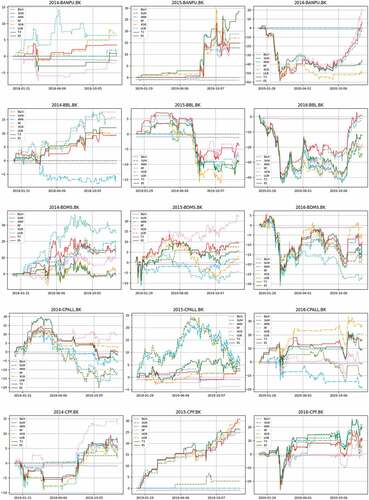
Figure 9. Continued.
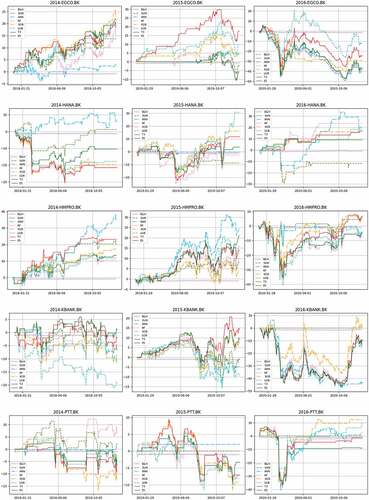
Table 5. Return Surpluses ΔX = RX – RBH
Table 6. Averages of return surplus (ΔX = RX – RBH), Sharpe ratios (Sr), and accuracy (Ac)
Table 7. Averages of returns from B&H (RBH)
Table 8. Average ranks of return
Table 9. Correlation coefficients (Cor) of return and accuracy