Figures & data
Figure 1. Architecture of the Crystal Cube event forecasting system.
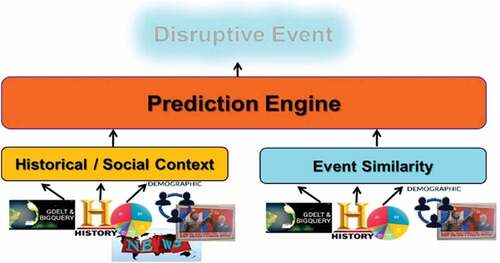
Figure 2. Method developed for computing event similarity.
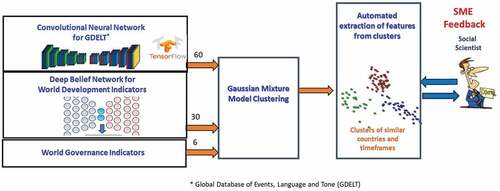
Figure 3. Crystal Cube’s inputs and outputs.
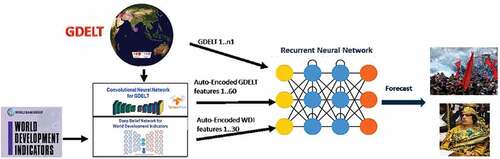
Figure 4. LSTM predictions for Ukraine for the test period: 1 Jan 2012–31 Dec 2020.
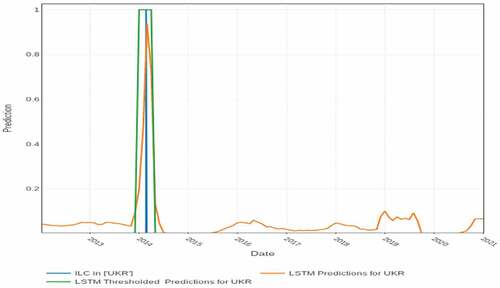
Figure 5. LSTM predictions for UK for the test period: 1 Jan 2012–31 Dec 2020.
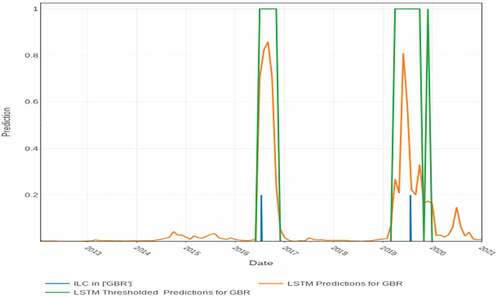
Figure 6. LSTM predictions for Sudan for the test period: 1 Jan 2012–31 Dec 2020.
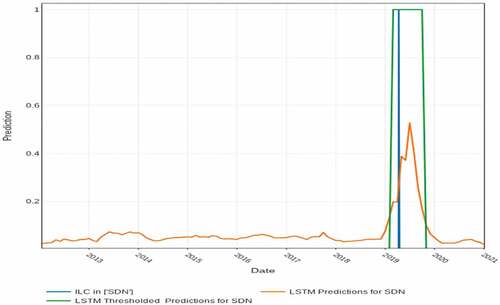
Figure 7. LSTM forecasts for July 2015.
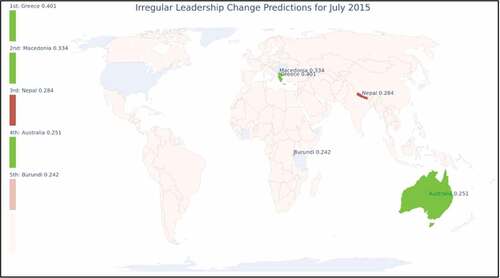
Figure 8. LSTM forecasts for March 2019.
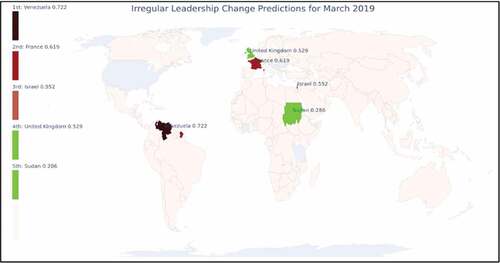
Table 1. Detailed description of events forecast for July 2015
Table 2. Detailed description of events forecast for March 2019
Figure 9. Random forest and LSTM ROCs for forecasting 1 month and up to12 months ahead.
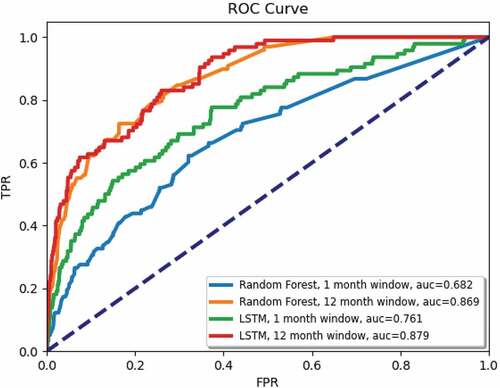
Figure 10. Random forest and LSTM Precision-Recall curves for forecasting 1 month and up to 12 months ahead.
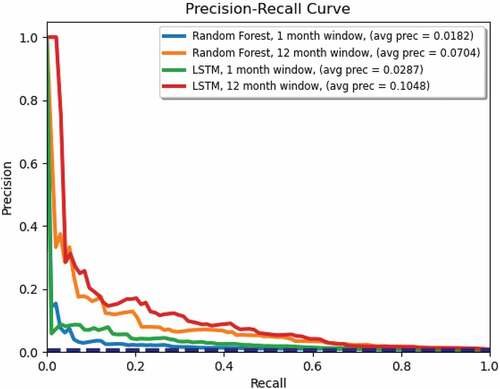
Figure 11. Random baseline and LSTM ROCs for forecasting 1 month and up to 12 months ahead.
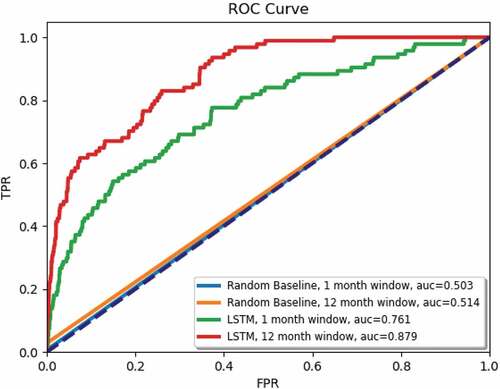
Figure 12. Random baseline and LSTM Precision-Recall curves for forecasting 1 month and up to 12 months ahead.
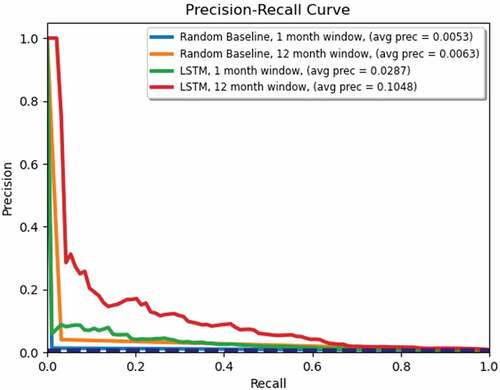
Table 3. Comparison of CC forecasts with those from Beger, Dorff, and Ward (Citation2016) and Ward and Beger (2017). Avg PR was not computed in Beger, Dorff, and Ward (Citation2016), – accuracy was computed instead
Figure 13. ROC for 1 month forecast – test data from .Beger, Dorff, and Ward (Citation2016)
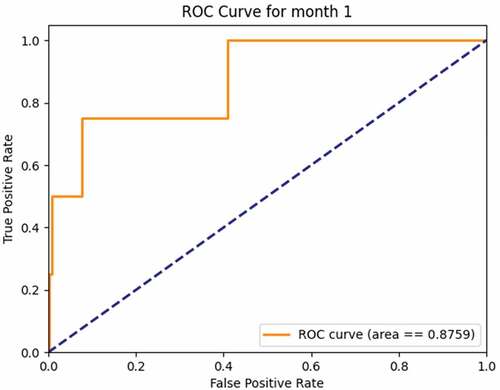
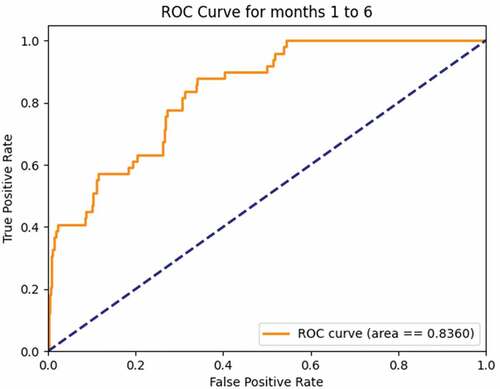
Figure 14. ROC for 6 month forecast by Crystal Cube – test data from Ward and Beger (2017).