Figures & data
Figure 1. Illustrative diagram of the definitions in DBSCAN.
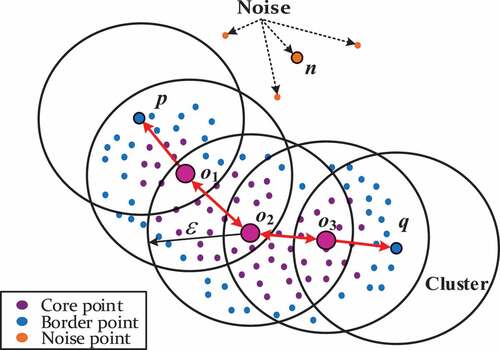
Figure 2. Flow chart of DBSCAN algorithm.
Figure 3. The flowchart for automatic and joint optimization of the feature fusion and clustering processes in AE signal analysis.
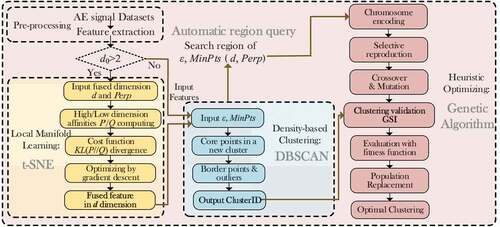
Table 1. Benchmark synthetic datasets and real-world datasets used in the validation
Figure 4. Clustering results of the proposed method on two-dimensional synthetic benchmark datasets: (a) dataset 1, (b) dataset 2, (c) dataset 3, (d) dateset 4 and (e) dataset 5.
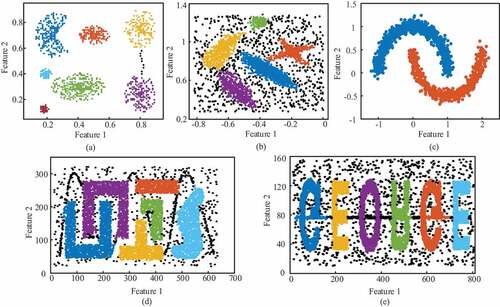
Figure 5. Clustering results of the proposed method on UCI real-world datasets: (a) dataset 6, (b) dataset 7, (c) dataset 8, (d) dataset 9 and (e) dataset 10.
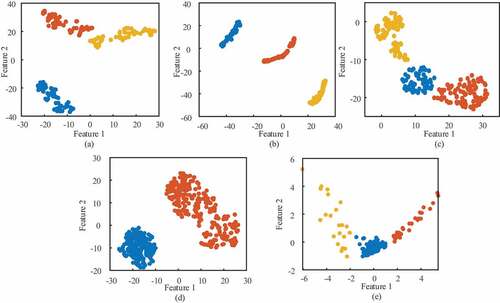
Figure 6. (a) Purity, (b) F1-measure and (c) ARIs of the comparing methods in the validating datasets (No. 1–10 in ).
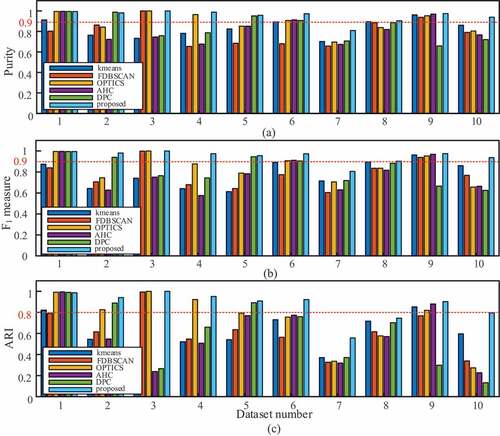
Figure 7. Region query in dataset 1 with (a) k-dist graph (Minpts = 10) and (b) GSI.
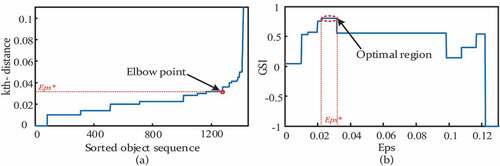
Table 2. Theoretical computational complexity of the mentioned clustering methods
Figure 8. (a) Schematic diagram of the tensile test system, (b) a closeup of the tensile testing machine and (c) a photo of the specimen and U75V rail steel.
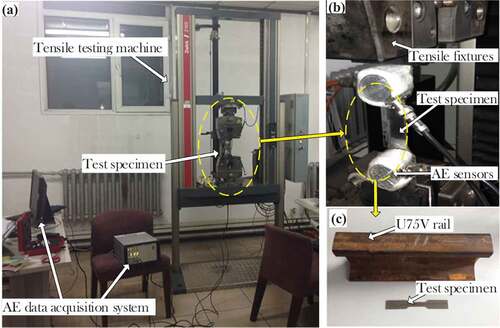
Table 3. Discriminative features for AE signal clustering
Figure 9. Optimization of t-SNE based on GSI for test 1.
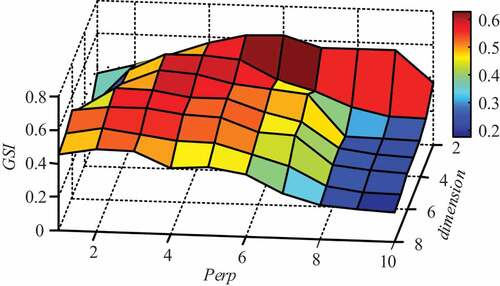
Figure 10. GSI distribution map for different parameters in clustering.
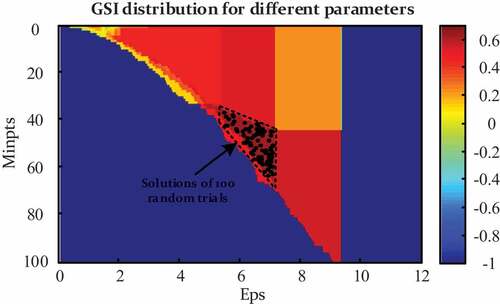
Figure 11. Visualization of clusters from (a) test 1, (b) test 2, (c) test 3 and (d) test 4 datasets in 2D features fused by t-SNE.
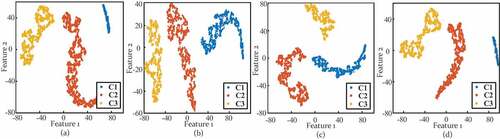
Figure 12. (a) Purities and (b) F1-measure of tensile tests in accordance with stage labels.
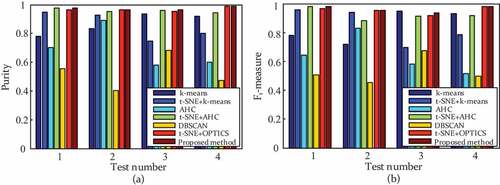
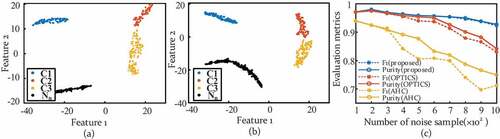
Figure 13. Clustering results of proposed method in random noise tests with a number of (a) 100, (b) 200 railway noise samples and (c) purities and F1-measures for the proposed method, OPTICS and AHC under variant noise interference.