
Figures & data
Figure 1. Cloud-Fog-IoT three-layer ecosystem architecture.
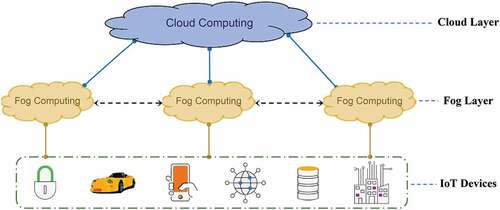
Figure 2. Some advantages of fog calculations.
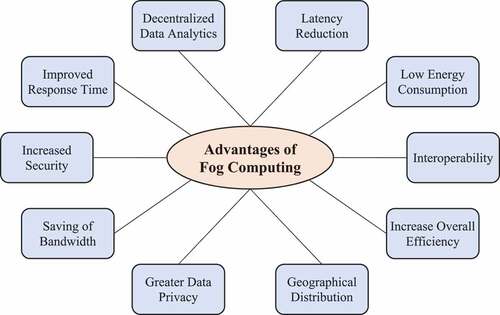
Table 1. Description of the symbols related to the problem of services placement
Table 2. A summary of the approaches examined
Figure 3. Taxonomy of services placement problem.
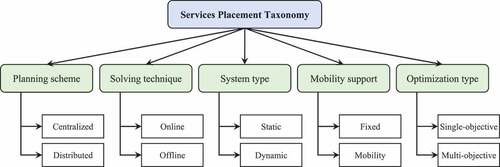
Figure 4. Proposed ecosystem framework with three layers of cloud-fog-IoT.
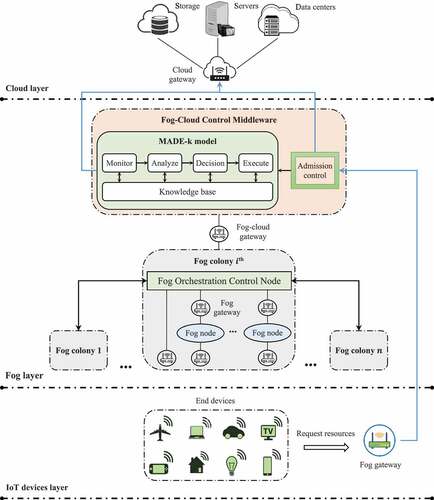
Figure 4. Continued.
Table
Table 3. Description of the symbols related to the PSO algorithm
Table 4. Fog colony structure and the IoT services requested for the first scenario
Figure 5. An example of a solution structure in the PSO algorithm.
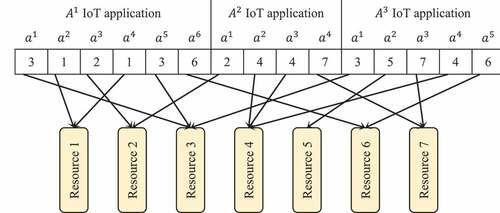
Table 5. Fog colony structure and the IoT services requested for the second scenario
Table 6. Details of resources for fog nodes
Table 7. Details of resources for different types of services
Figure 6. Comparison results of different algorithms based on convergence speed for one period.
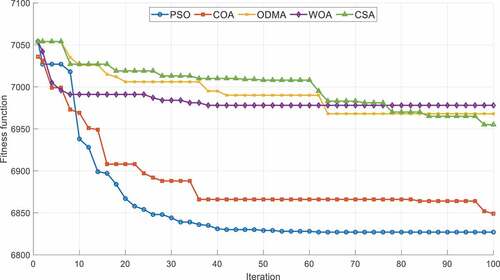
Figure 7. Comparison results of different algorithms based on runtime for one period.
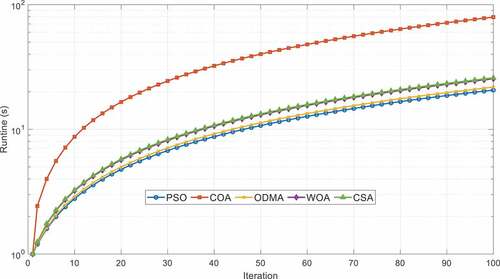
Figure 8. Comparison results of different algorithms based on the fitness function for one period.
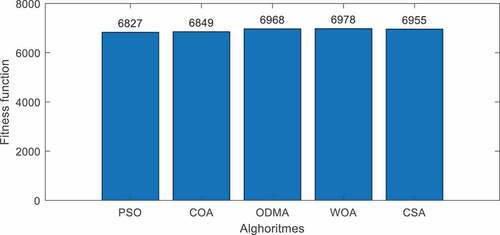
Figure 9. Comparison results of different algorithms based on the number of services performed before the deadline for 10 periods.
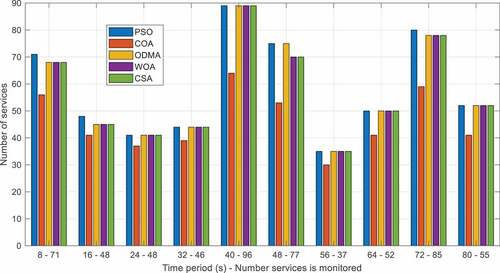
Figure 10. Comparison results of different algorithms based on the runtime for 10 periods.
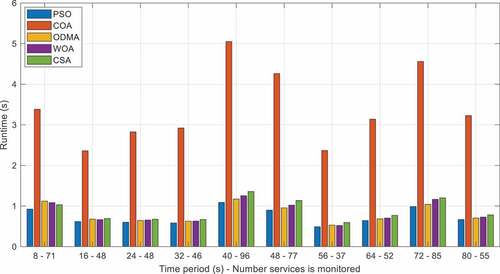
Figure 11. Comparison results of different algorithms based on the average waiting time before the deadline for 10 periods.
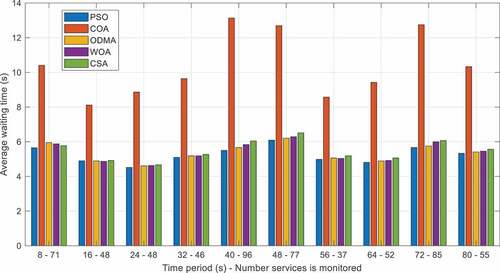
Figure 12. Comparison results of different algorithms based on the number of failed services for 10 periods.
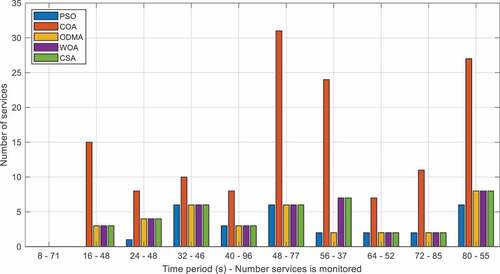
Figure 13. Comparison results of different algorithms based on the fitness function for 10 periods.
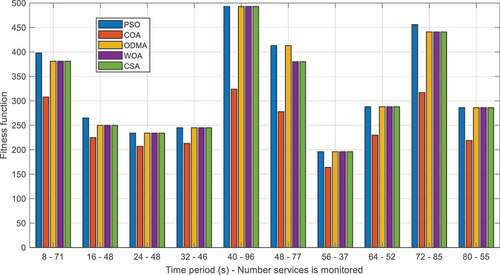
Figure 14. Comparison results of different algorithms based on the average fitness function after the end of 10 periods.
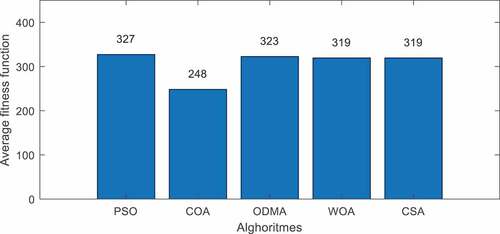
Table 8. Comparison results of different algorithms based on the number of remaining services for planning in the 11th period
Table 9. Summary of results of different algorithms