
Figures & data
Figure 1. Location of the study area and collected samples.
Table 1. Descriptive variables of the northern Great Basin geochemical data set that were considered for analysis in this work
Table 2. Statistical measures (mean and standard deviation) for the concentrations of chemical components found in soil samples
Figure 2. Distribution of samples in the three clusters, divided by the K-means expressed by the two principal components. Cluster 1 = black circles, Cluster 2 = red triangles and Cluster 3 = green crosses.
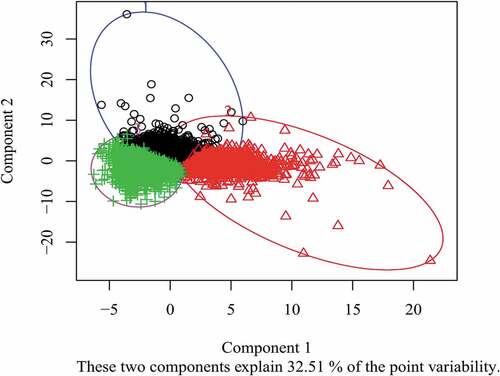
Table 3. Mean and standard deviation values for the concentrations of the chemical elements in soil samples taken from the three clusters
Figure 3. Mean values for the concentration of the ten most relevant elements determined by the CFS feature selection technique.
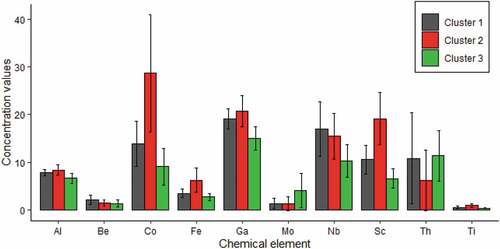
Figure 4. Map from the location from which each sample was collected. Cluster 1 = gray, Cluster 2 = red and Cluster 3 = green.
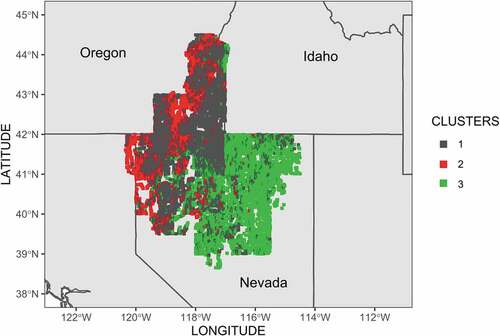
Table 4. Accuracy values achieved by the SVM models developed on the original feature set and on the feature subset determined by the CFS. The best values for the model parameters computed by grid search are also shown