
Figures & data
Table 1. Number of audits and incidence of fraud by main audit types and in total
Figure 1. Fraud prediction approach using machine learning.
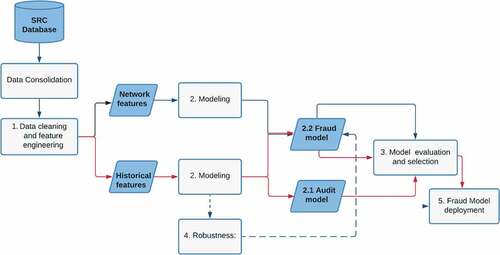
Table 2. Mean values of selected predictors of audit and fraud used in the study
Figure 2. Fraud distribution by taxpayer tenure (2019).
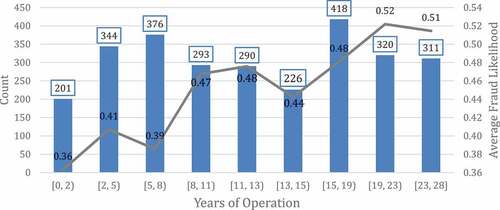
Figure 3. Fraud distribution by the taxpayer sector (NACE) of operation (2019).
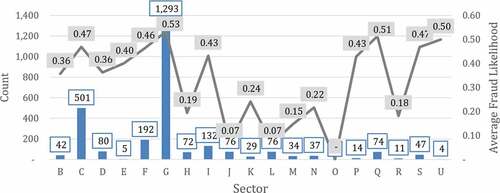
Figure 4. Effect of historical audits and frauds on probability of fraud in 2019.
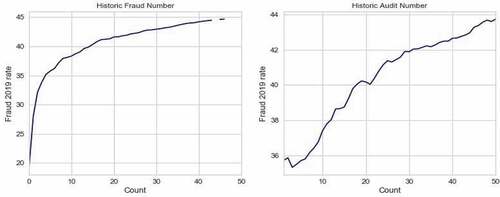
Table 3. Results of Audit and Fraud classification models
Figure 5. SHAP values for the variables used in the baseline fraud model.
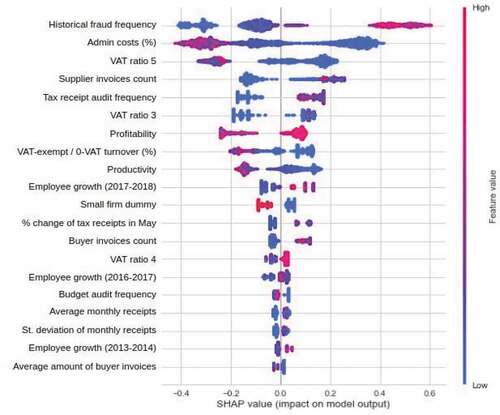
Table 4. Audit model predictions and Fraud model actual accuracy by deciles
Table 5. Taxpayer’s network (supplier and buyer) characteristics used in the fraud model
Table 6. Comparison of fraud model performance with the exclusion of historical data and inclusion of taxpayer’s network information
Table A1. NACE Rev. 2 economic activity code key for
Table A2. Feature definitionsFootnote13
Table A3. Results of Audit Classification models
Table A4. Robustness: Alternative definitinos of target fraud variable