Figures & data
Figure 1. Structure diagram of convolutional neural network.
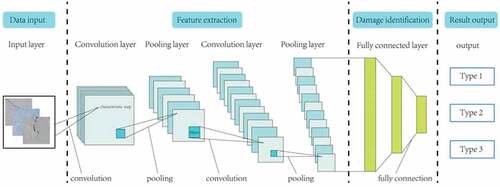
Figure 2. An example of convolution computation, the step size is 1. The upper part is the convolution operation of multiple pictures, and the lower part is the visualization of one step in the convolution calculation.
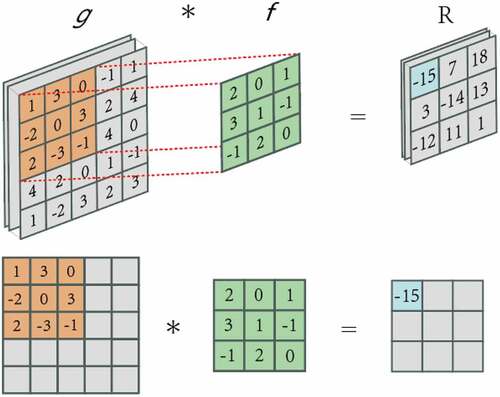
Figure 3. An example of Max pooling, the step size is 1.
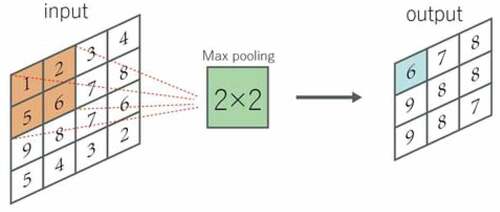
Figure 4. An example of Avg pooling, the step size is 1.
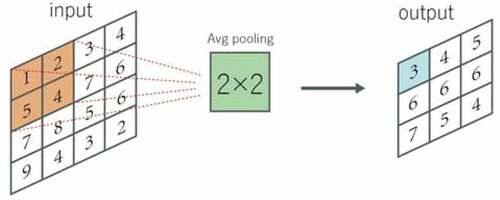
Figure 5. Sigmoid function image.
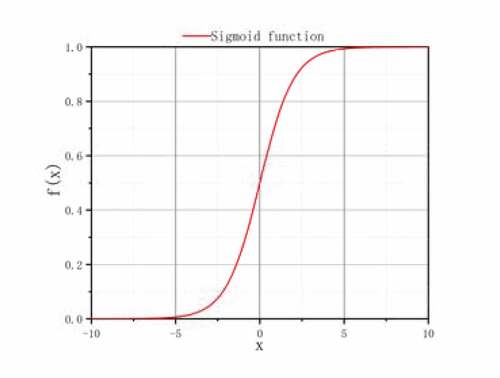
Figure 6. ReLU function image.
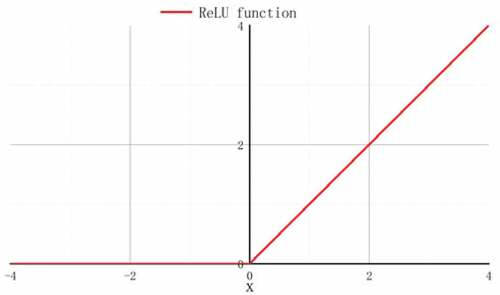
Figure 7. Neuron (Perceptron).
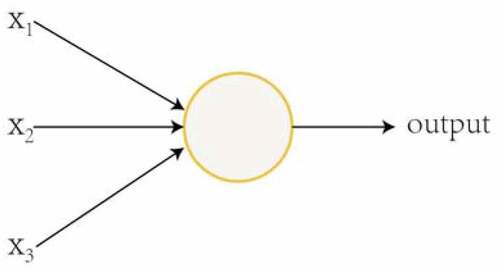
Figure 8. A simple example of fully connected network.
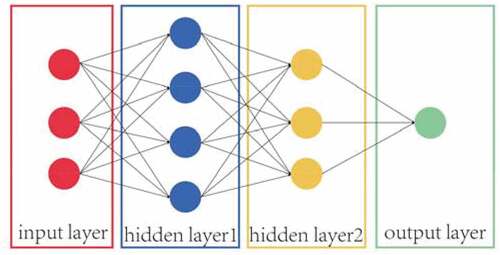
Figure 9. All above are cracked images. From top to bottom: unclear and hard to detect cracks; small cracks; obvious and clear cracks.
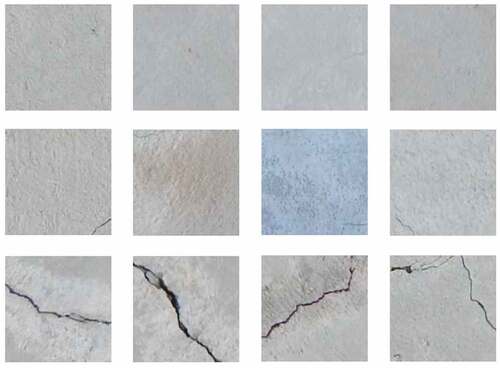
Figure 10. All above are uncracked images. The upper part are smooth uncracked images, the lower part are rough uncracked images.
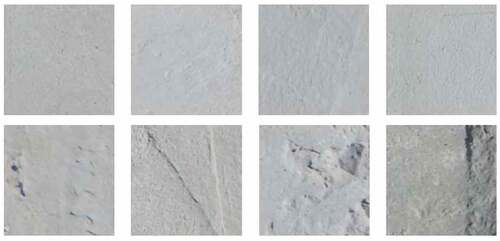
Figure 11. An image of the original crack in the dataset.
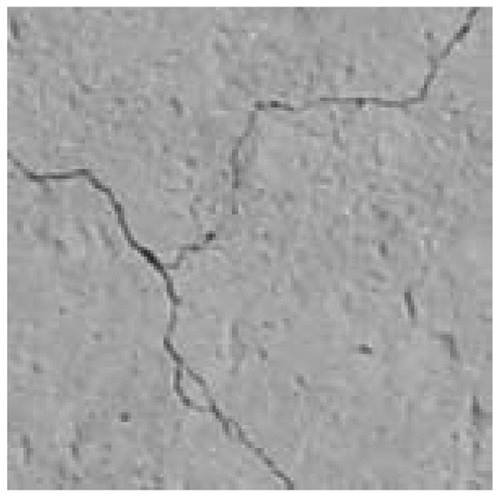
Figure 12. Four images are obtained by image enhancing.
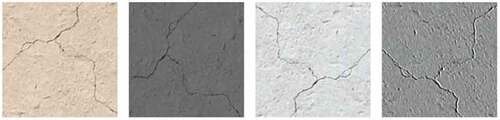
Table 1. Number of images before augmentation
Table 2. Number of images after enhancement
Table 4. Loss, RMSE and accuracy of cross-validation results for each prediction model
Figure 13. Change trend of loss.
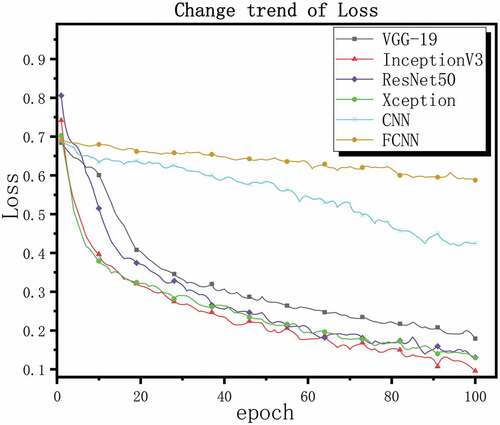
Figure 14. Change trend of RMSE.
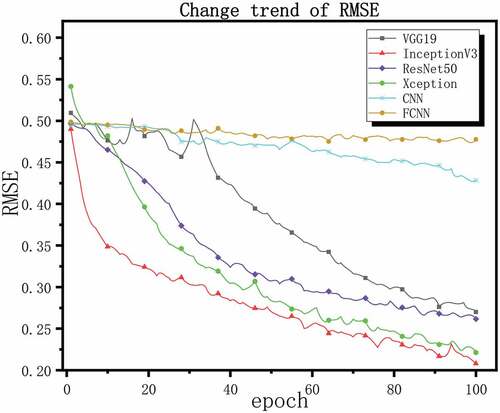
Figure 15. Change trend of accuracy.
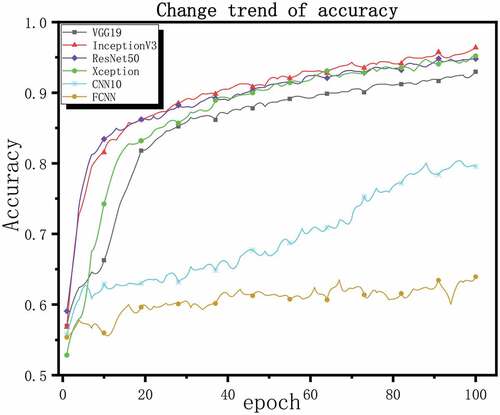
Table 5. Results of precision, recall and F1-score
Figure 16. Confusion matrix results of four models.
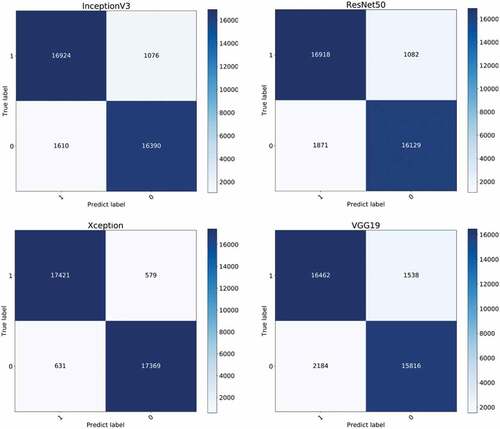
Table 6. Precision, recall and F1-score of cross-datasets research
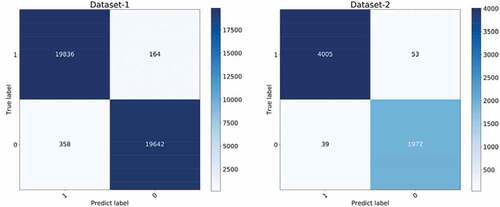
Figure 17. Confusion matrix results of cross-datasets research.