
Figures & data
Figure 1. Overall methodology of the study.
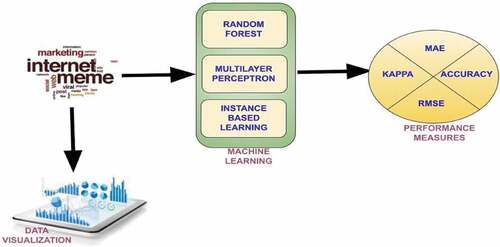
Figure 2. Popular memes considered for the study.
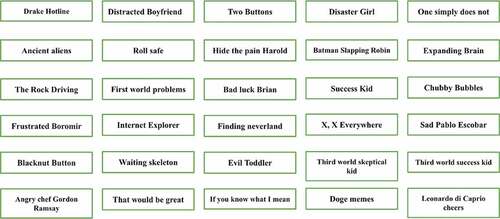
Figure 3. (a-d) Number of Captions over time for Internet Memes (individual graphs)
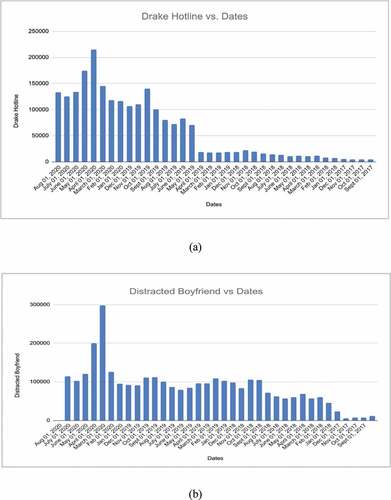
Figure 3. Continued.
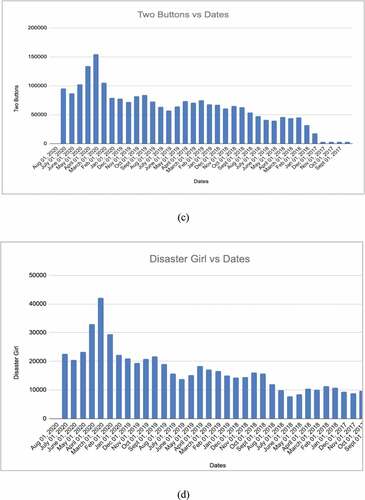
Figure 4. Line plots depicting number of captions over time for internet memes.
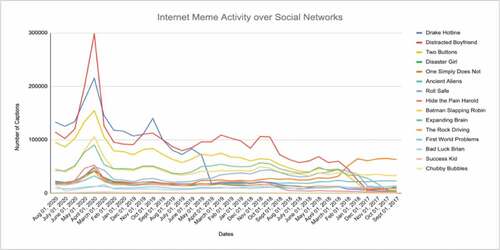
Figure 5. Line plots depicting number of captions over time for internet memes.
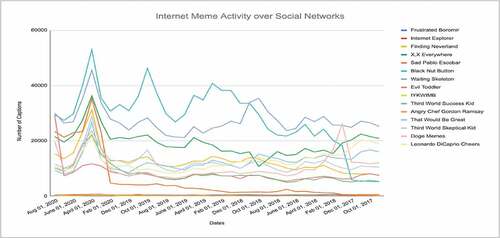
Figure 6. Overall internet meme trend (September 2017- August 2020).
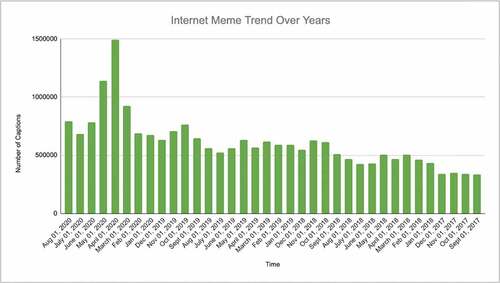
Figure 7. Heat map with 8 clusters.
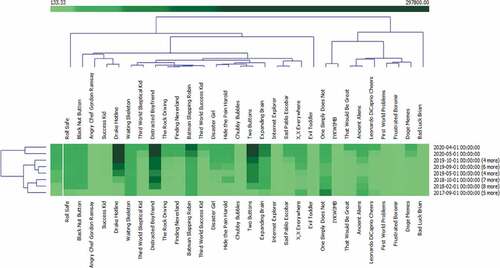
Figure 8. Heat map with 15 clusters.
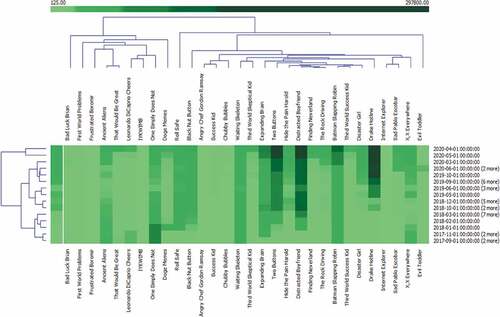
Figure 9. RF forecast.
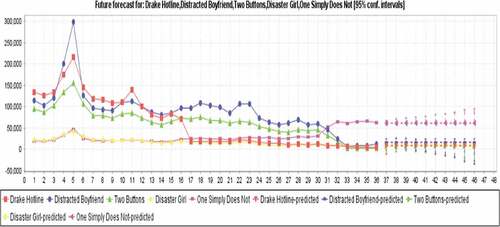
Figure 10. IL forecast.
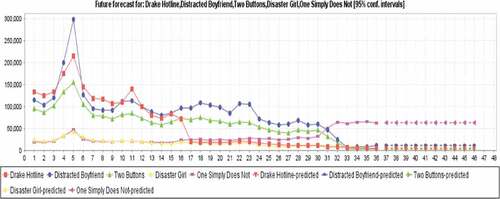
Figure 11. MLP forecast.
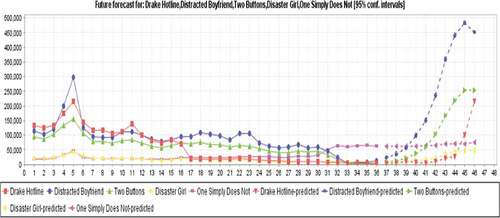
Figure 12. Classification accuracy.
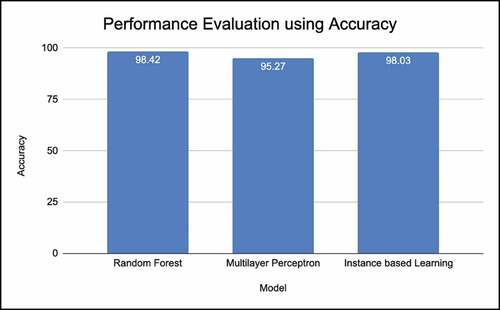
Figure 13. Kappa statistic.
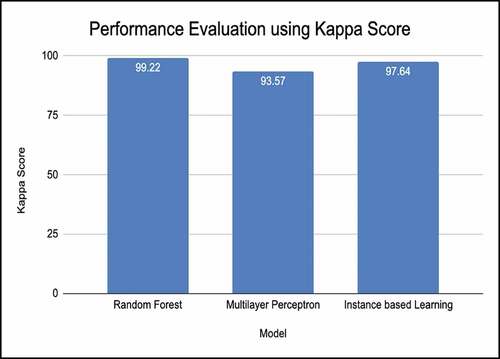
Figure 14. MAE and RMSE plots.
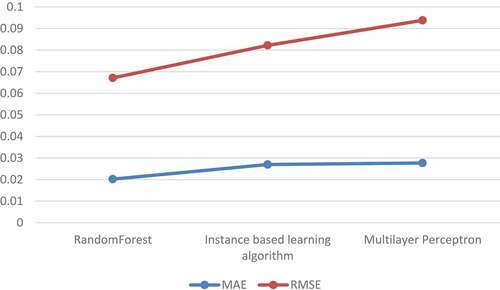
Table 1. Comparative analysis of our work with existing works