Figures & data
Figure 1. The diagram demonstrates the flow of Interest packet to search content. There are two clients C1 and C2, requesting content N1 and N2 respectively. P1 and P2 are the generators of N1 and N2. Moreover N1 is cached in CR1 and hence C1 is may be served by CR1 and C2 is served by the actual producer of N2 (as it is not cached in any CR). Our algorithm tries to predict the appropriate location of the cache store using ML models.
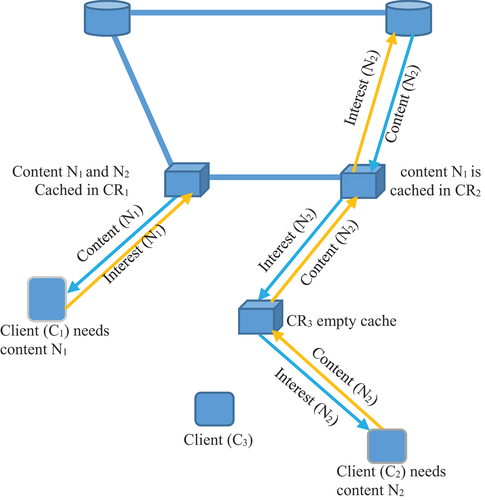
Figure 2. System model for applying ML in ICN routing is presented in the diagram. Flow of operation starting from data collection till the findings of the proposed work as comparison of predicted and actual success rate of Interest packet is depicted.
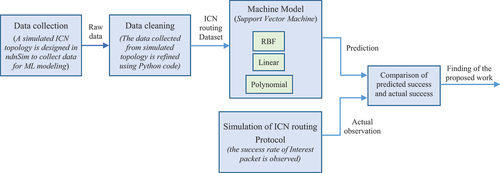
Table 1. A comparison of similar work with proposed forwarding strategy
Table 2. List of features in the dataset with their description. These are the features that captured at the time of collecting data from the simulation environment designed for ICN network using ndnSim. Later these features are analyzed to find the most important features to classify the dataset
Figure 3. Correlation of features for determining the classification of data points. The two features namely ‘popularity’ and ‘ttl_value’ shows highly related correlation with values of 0.51 and 0.46, respectively. These two features are used for SVM classification in the later part of this work.
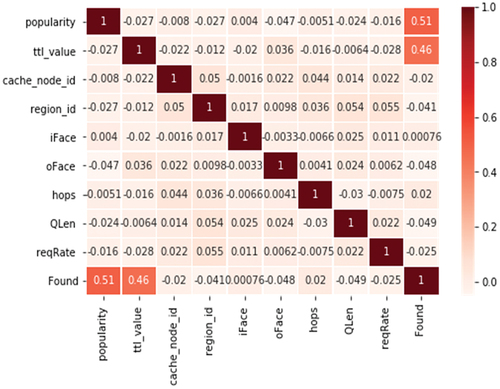
Table 3. Comparison of prediction and accuracy of the content retrieval for different features. This tables shows the best results with two features, popularity and ttl_value. (Parameters Gamma = 0.7, C = 100; all values are in %-age)
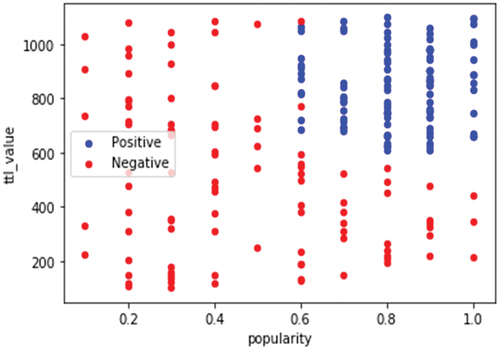
Figure 4. Scatter plot of the ICN dataset to observe the separability for classification. correlation of features for determining the classification of data points. The data could be linearly separated with little misclassification. So, SVM is used for modeling.
Table
Table 4. Simulation parameter
Figure 5. A sample simulation topology based on US26 network. Approximately 1000 unique contents with a size of 5000B is taken for simulation. The cache store size is of 50–150 contents. Nodes with dotted circles have betweenness centrality (BC) value in the range 3–5 and results are collected in these CR nodes.
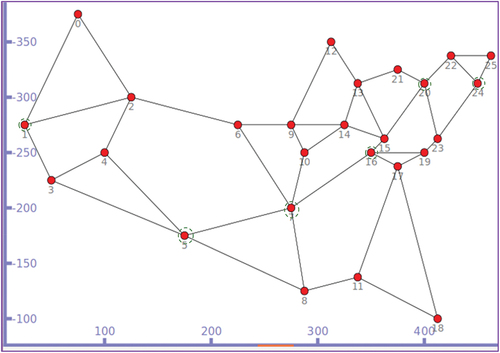
Figure 6. Interest packet success rate over simulation time. The plot considers those successful processing whose content is found in intermediate cache. Serving from the actual producer is not counted in the above results.
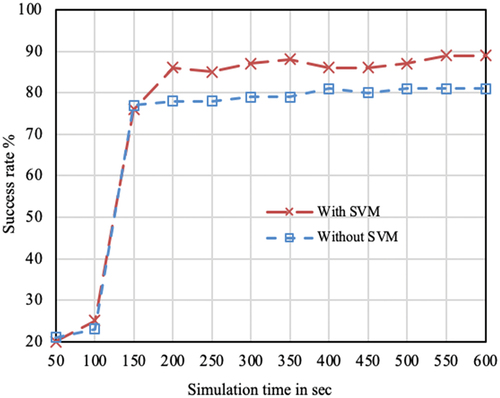
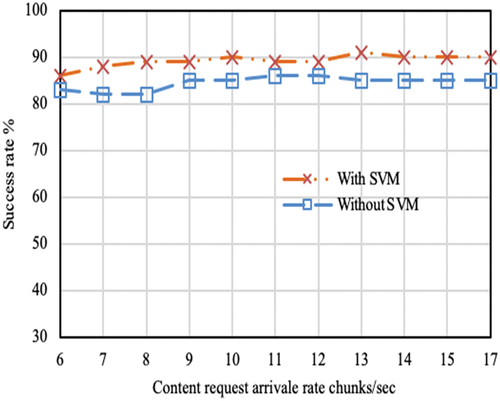
Figure 7. Interest packet success rate over request arrival rate. The plot considers only successful Interest requests served from the cache. Results are recorded after 100sec of simulation progress. By this time elapse most of the caches are filled with sufficient amount of data. Hence, there is a high possibility of getting data in cache.