Figures & data
Table
Table 1. PRCB algorithm framework
Table 2. PRCB constraint phase algorithm framework
Table 3. PRCS algorithm framework
Table 4. Network information
Figure 1. For ANM<1>, in different networks and data sets, the structural error of the PRCB algorithm at different thresholds.
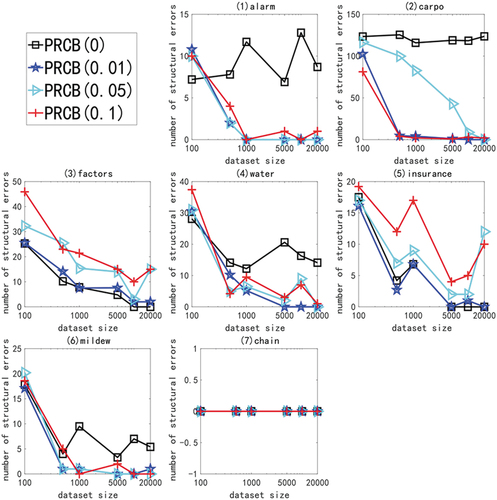
Figure 2. For ANM<1>, the structural errors and running time of the nine algorithms in different networks and data sets.
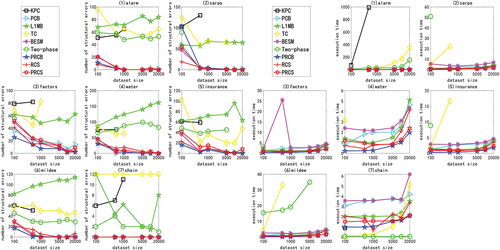
Figure 3. For ANM<2>, the structural error and running time of the five algorithms in different networks and data sets.
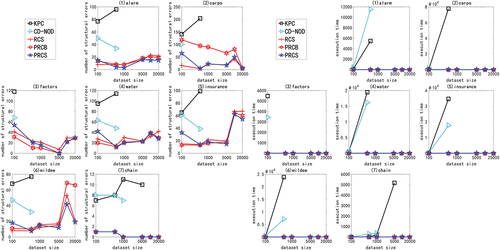
Figure 4. For ANM<3>, the structural error and running time of the five algorithms in different networks and data sets.
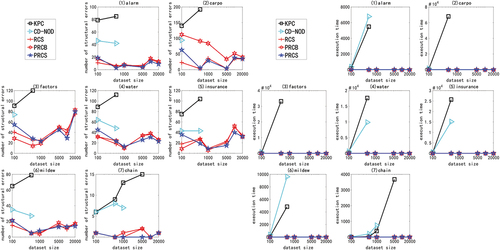
Figure 5. For ANM<6>, the structural error and running time of the five algorithms in different networks and data sets.
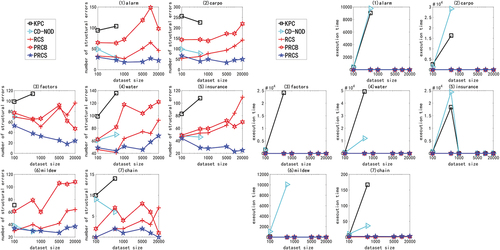
Table 5. Network information
Figure 6. For ANM<1>, the structural error and running time of the two algorithms on the high-dimensional network large sample data set.
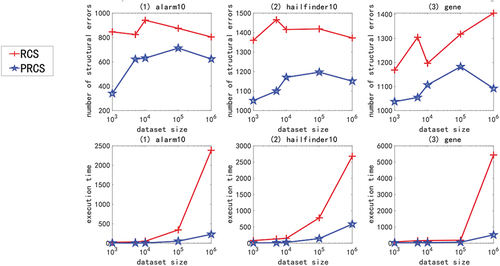
Figure 7. For ANM<2>, the structural error and running time of the two algorithms on the high-dimensional network large sample data set.
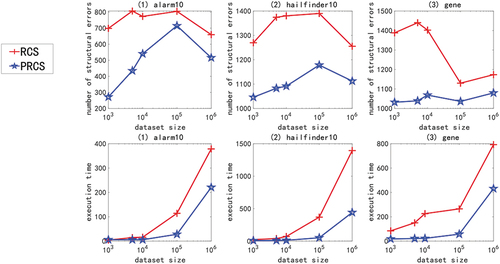
Figure 8. For ANM<6>, the structural error and running time of the two algorithms on the high-dimensional network large sample data set.
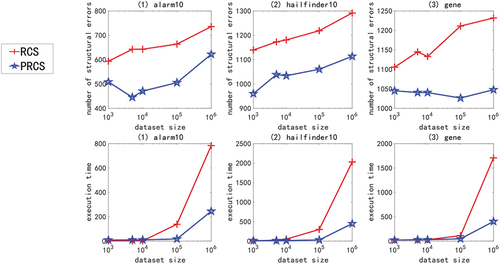
Table 6. Performance comparison of PRCS and RCS on high-dimensional large sample data
Table 7. Some sensor measuring point information of a power plant
Figure 9. Flow chart of causal fault detection system based on partial rank correlation.
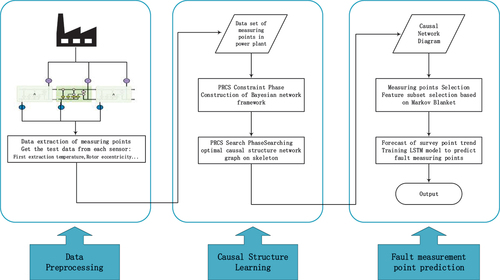
Figure 10. Part of the causality diagram of a measuring point in a power plant.
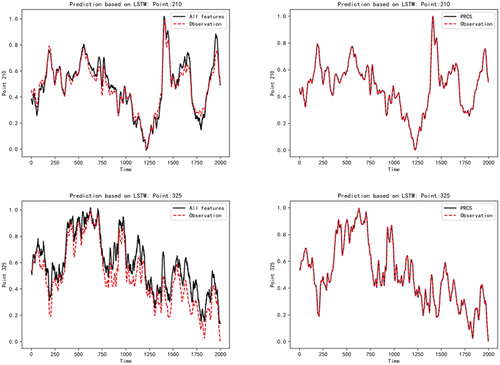
Figure 11. Experimental results of power plant fault measurement points prediction.
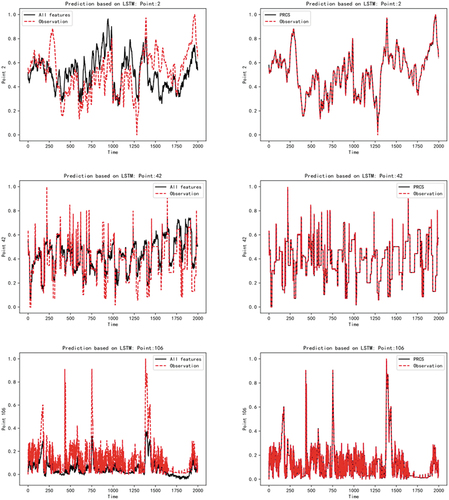
Figure 11. Continued.