
Figures & data
Figure 1. Population class model for the developed EM.
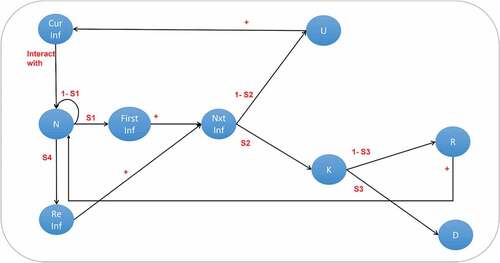
Table 1. Summary of the variables and parameters of the developed EM
Table 2. Summary of the result of the validation according to the population size and density for the 10 Moroccan cities
Figure 2. The actual number of infections versus the predicted number of infections per day on top of each subfigure. The actual number of deaths versus the predicted number of deaths per day on the bottom of each subfigure, in the ten Moroccan cities.
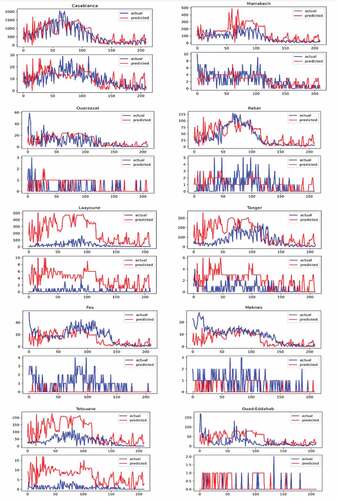
Figure 3. Episodic reward and variance monitoring for the three models for different health score thresholds.
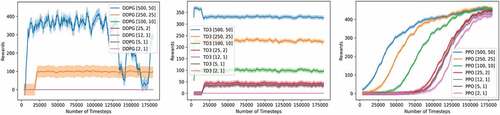
Figure 4. PPO performance against different economic thresholds (Te).
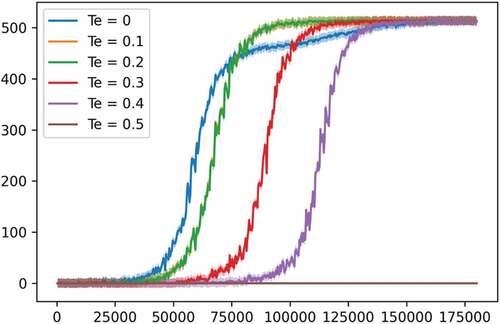
Figure 5. The effect of the economic score weights on the performance and policy.
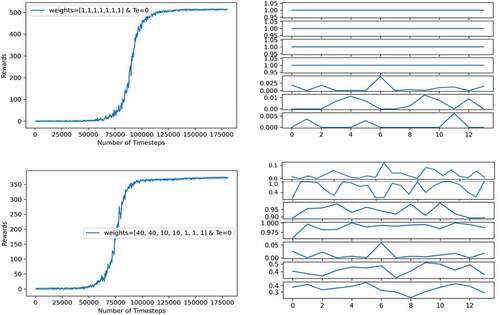
Figure 6. The effect of stochasticity on the performance of the PPO model.
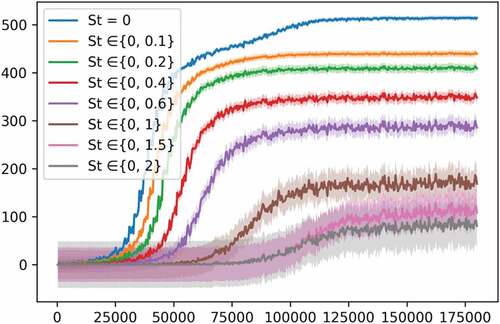
Figure 7. The performance of the DDPG, TD3, and PPO on the easier reward function.
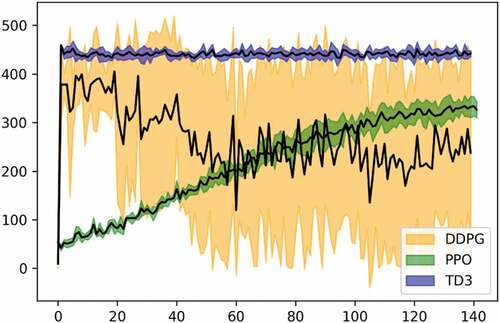
Table 3. Timeline of the interventions and relaxation implemented in Morocco
Figure 8. Optimal hyperparameter sets for the three models used (DDPG, TD3, and PPO from left to right respectively).
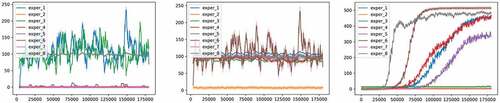
Table 4. Hyperparameters tested for each deep RL model