
Figures & data
Figure 1. Comparison of MMSB graphical models: (a) Traditional (b) Graphical model in BAM notation.
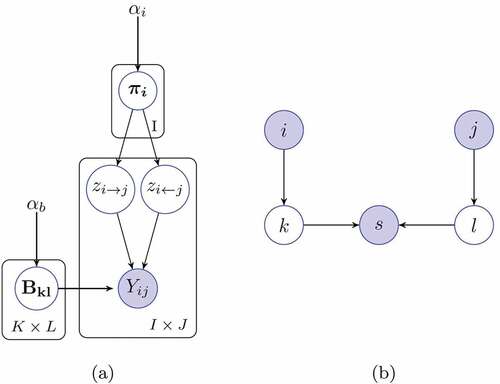
Figure 2. Count tensor representation of a binary adjacency matrix.
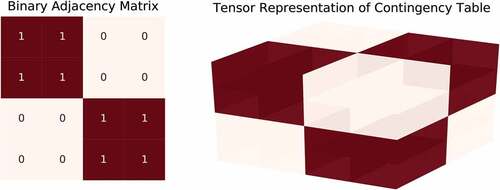
Table 1. estimations in 50 experiments for three different connectivity levels. From top to down, the connectivity parameter
takes values of
respectively.
Table 2. Ratio of correct estimations with respect to total estimations out of 50 replicates for .
Figure 3. Estimated number of blocks as the scaling factor
for each index is increased.
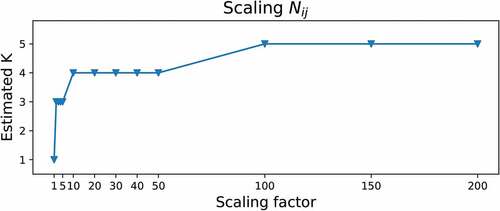
Figure 4. Weighted pseudocounts of the contingency tensor for each weighting scheme.
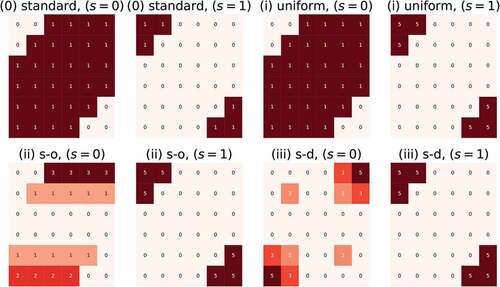
Figure 5. The selected number of blocks for benchmark networks. The top and bottom row illustrate the results for (i) uniform and (ii) source-dest.
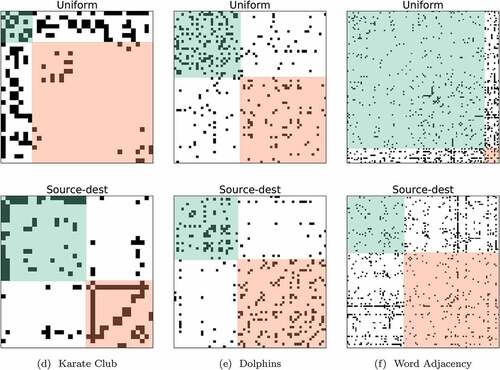
Table 3. Estimated number of clusters for dolphin data.