
Figures & data
Figure 1. SIRVC model: susceptible-infectious-recovered with vaccinations and inter-community interactions. An additional term moves susceptible individuals into the infectious group through interactions with external communities.
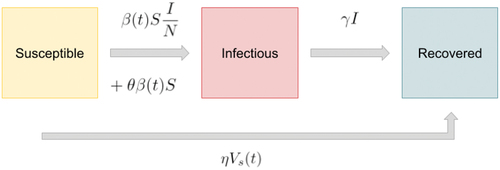
Table 1. Nomenclature.
Figure 2. Architecture and adaptive physics-guided loss function for GAT vertex.
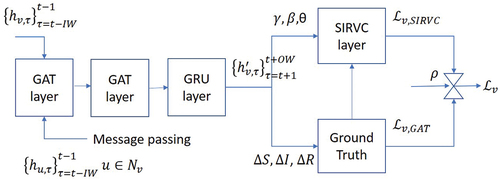
Figure 3. Layered ensemble architecture for multi-scale pandemic prediction ranging from country through global level.
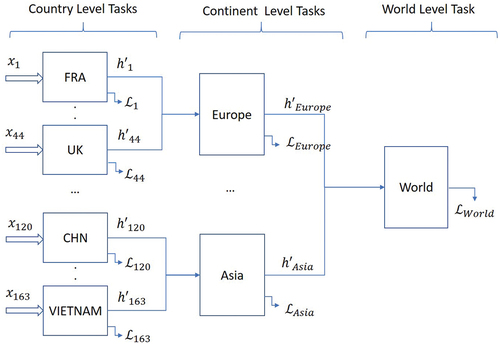
Table 2. Country-level GAT structure.
Figure 4. Country SIRVC-GAT prediction (proposed layered ensemble model: (a) USA; (b) UK.
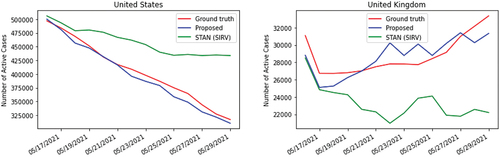
Figure 5. Country SIRVC-GAT prediction with fixed loss: (a) USA; (b) UK.
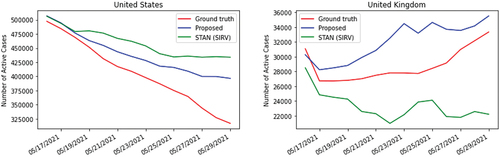
Figure 6. Country SIRVC-GAT prediction without edge weight: (a) USA; (b) UK.
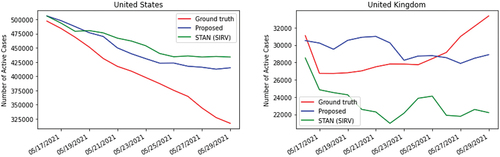
Figure 7. United States GAT model: final graph layer attention visualization. Edge color corresponds to min-max normalized edge attention.
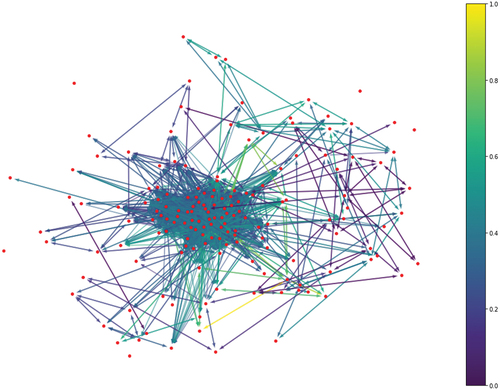
Table 3. Performance comparison for country-level model variations.
Figure 8. Peer learning (Algorithm 1) for the prediction of Covid-19 epidemics: (a) USA; (b) UK.
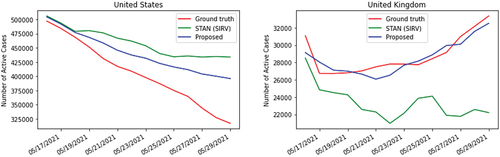
Figure 9. Middle ensemble layer predictions (Algorithm 2): Continent MLP trained with country SIRVC-GAT prediction: (a) Africa; (b) Asia; (c) Europe; (d) North America; (e) Oceania; (f) South America.
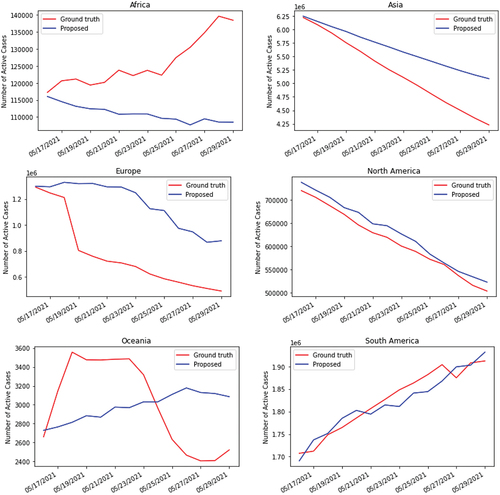
Figure 10. Final ensemble layer prediction: World MLP trained with continent MLP prediction (proposed ensemble model described by Algorithm 2) compared to 1) using randomized country grouping in the middle layer and 2) training without a middle/continent layer.
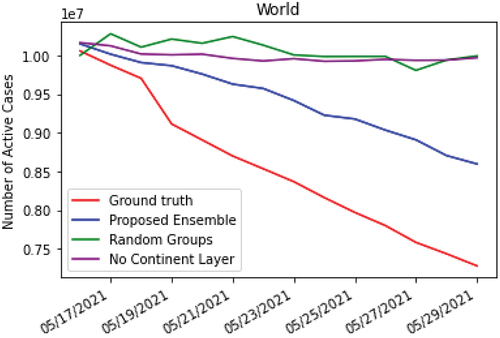
Table 4. Performance comparison for proposed layered ensemble (Algorithm 2) against baselines.