
Figures & data
Figure 1. Proposal of camera and smart traffic lights installation in an intersection.
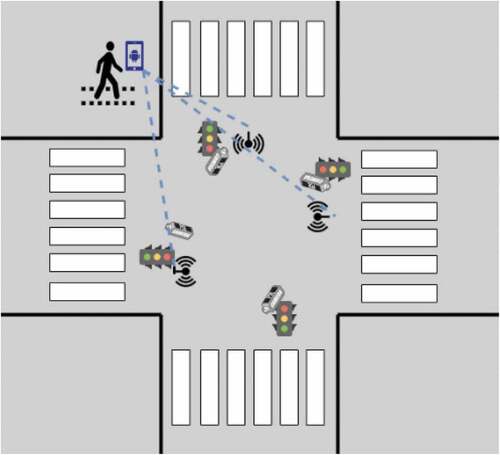
Figure 2. Overview of the system design for the proposed mobile assistive system.
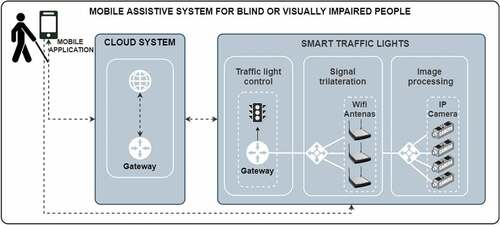
Figure 3. Process flow diagram of the mobile assistive system for blind or visually impaired people.
Figure 4. Image of a pedestrian crossing retrieved from a Seebot agent installed at an intersection.
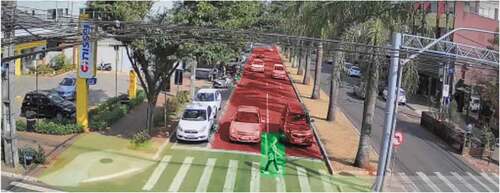
Figure 5. Mobile application for street crossing assistance screenshots.
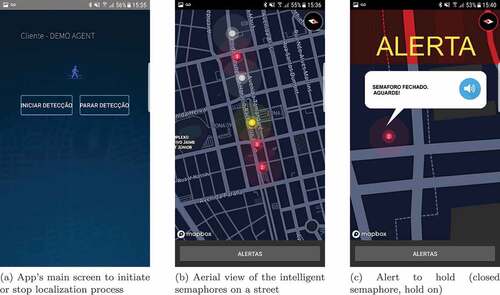
Table 1. Number of app connections, assistance for safe crossings, and successful data fusion of the system operating over a 3 month period.