
Figures & data
Table 1. Number of SRs and population per city and year
Table 2. Standardized minor SR types under twelve major categories; the top row shows the major categories and the following rows show the minor types
Figure 1. Percentage of major SR categories in each city.
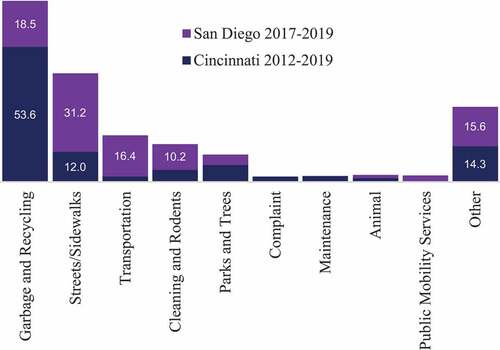
Table 3. Number of SR types before and after standardization in each city
Figure 2. LSTM memory cell architecture.
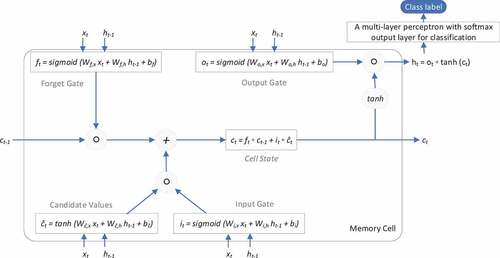
Table 4. The vocabulary size of SR descriptions, the maximum length of SR descriptions, and the training and test classification accuracy, in each city
Table 5. Misclassified SR descriptions from different cities and the reason for their misclassification by the machine
Data Availability Statement
The data in this study is available at http://us-cities.survey.okfn.org/