Figures & data
Figure 2.1. UAV position and Euler angles in 3D simulation environment.
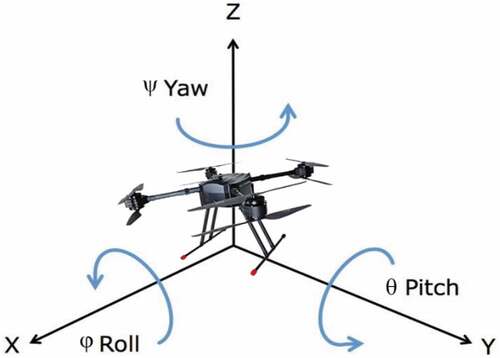
Figure 3.1. Simulation LiDAR sensor adopted in this work, Velodyne VLP-16 model.
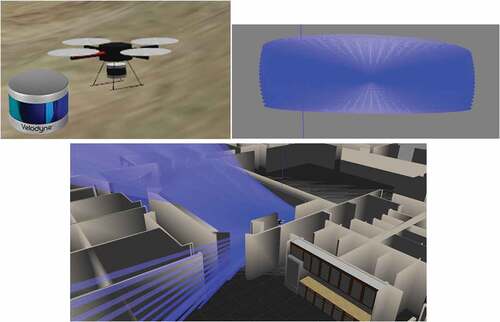
Figure 3.2. Left: Truncated icosahedron structure, Middle: UAV in environment, Right: A UAV’s perception of surrounding objects.
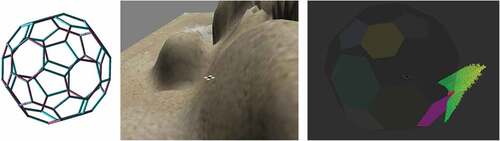
Figure 3.3. Features extraction network structure. The parameters of one-dimensional convolutional layer (Conv1) denote its filters and its kernel size respectively and for the other layers, it denotes dimensionality of output. Each layer’s activation function is Rectified Linear Unit (ReLU).
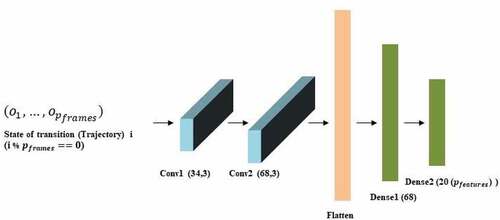
Figure 3.4. The process flow of Augmentative Backward Reward function (ABR).
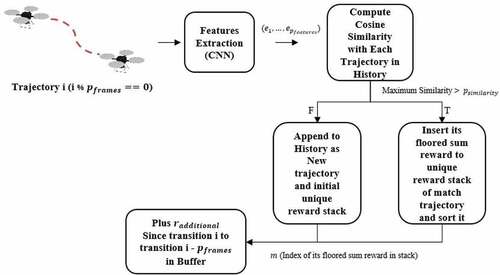
Figure 3.5. The process flow of proposed method in autonomous UAV navigation task. The UAV (agent) ask the actor network for next action and then the critic network will evaluate that selected action.
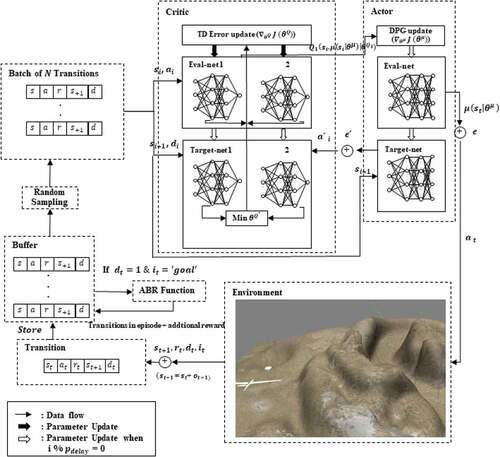
Table 1. Attributes and Hyper-parameters for this work.
Figure 4.1. The 3D static simulation environment. Left: Top view of all whole map. Right: Main view of center of map. The white cylinder is goal point.
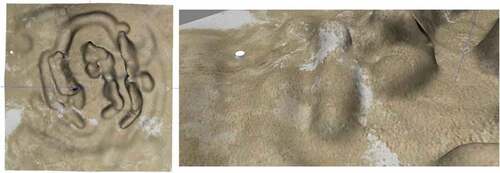
Figure 4.2. Experimental result in static environment. Left: Average success rate that UAV reach the goal point. Right: Average collision rate that UAV collide with environment surface. (The figure is designed for color version).
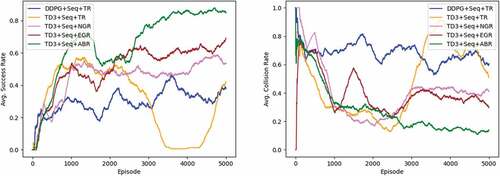
Figure 4.3. The 3D dynamic simulation environment. Left: Top view of all whole map. Right: Main view of center of map.
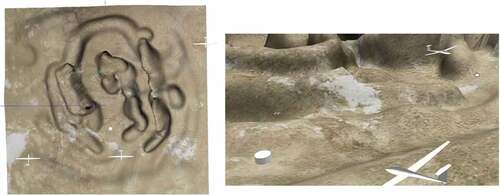
Figure 4.4. Experimental result in dynamic environment. Left: Average success rate. Right: Average collision rate. (The figure is designed for color version).
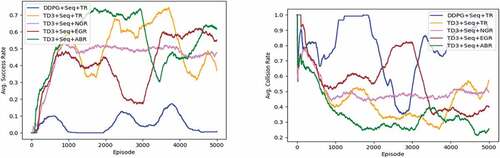
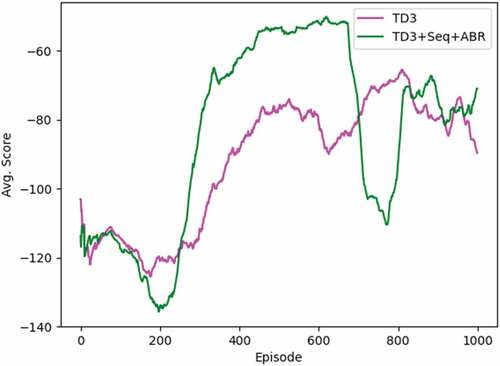
Figure 4.5. Experimental result of TD3 method and TD3+Seq+ABR method (Proposed) in other navigation task, BipedalWalkerHardcore. (The figure is designed for color version).