Figures & data
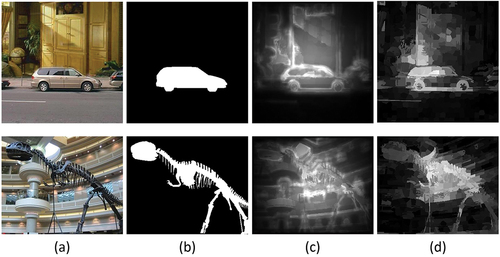
Figure 1. Comparison with prior based saliency detection methods (a)original image (b)groundtruth (GT) (c)GR (Yang, Zhang, and Lu Citation2013) (d)MR (Yang et al. Citation2013) (e)LGSD-DCPCNN.
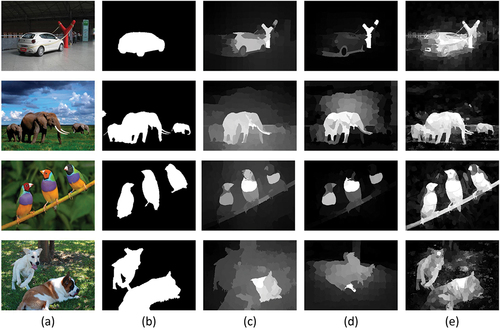
Figure 2. Process of proposed algorithm.
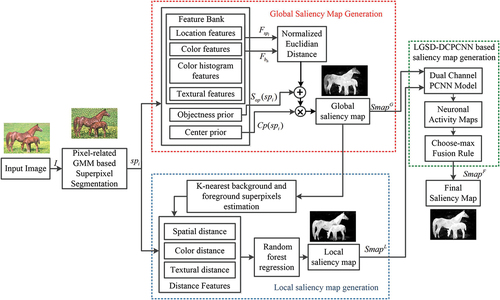
Table 1. Features used for generating global saliency map.
Table 2. Features used in local saliency map generation.
Table 3. Salient object detection datasets.
Table 4. Evaluation metrics for salient object detection.
Figure 3. Qualitative analysis of the proposed algorithm on DUTOMRON dataset compared to other salient object detection techniques (a)Original Image (b)Groundtruth (c)CA (d)GR (e)SEG (f)MR (g)MC (h)LPS (i)RR (j)LGF (k)DPSG (l)NCUT (m)RCRR (n)SMD (o)LGSD-DCPCNN.
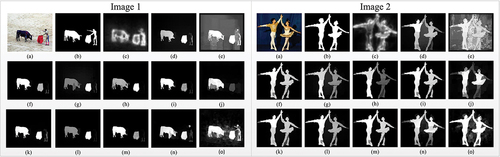
Figure 4. Qualitative analysis of the proposed algorithm on ECSSD dataset compared to other salient object detection techniques (a)Original Image (b)Groundtruth (c)CA (d)GR (e)SEG (f)MR (g)MC (h)LPS (i)RR (j)LGF (k)DPSG (l)NCUT (m)RCRR (n)SMD (o)LGSD-DCPCNN.
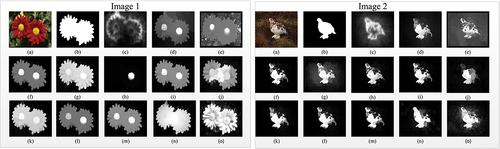
Figure 5. Qualitative analysis of the proposed algorithm on HKUIS dataset compared to other salient object detection techniques (a)Original Image (b)Groundtruth (c)CA (d)GR (e)SEG (f)MR (g)MC (h)LPS (i)RR (j)LGF (k)DPSG (l)NCUT (m)RCRR (n)SMD (o)LGSD-DCPCNN.
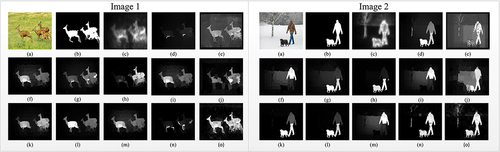
Figure 6. Qualitative analysis of the proposed algorithm on SOD dataset compared to other salient object detection techniques (a)Original Image (b)Groundtruth (c)CA (d)GR (e)SEG (f)MR (g)MC (h)LPS (i)RR (j)LGF (k)DPSG (l)NCUT (m)RCRR (n)SMD (o)LGSD-DCPCNN.
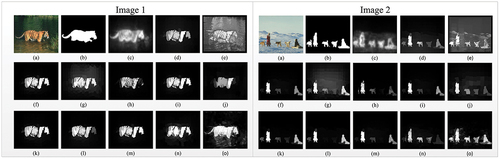
Figure 7. Quantitative analysis of the proposed algorithm based on the PR curve on four benchmark saliency detection datasets (a)DUT-OMRON (Yang et al. Citation2013) (b)ECSSD (Shi et al. Citation2015) (c)HKUIS (Li and Yu Citation2015) (d)SOD (Movahedi and Elder Citation2010).
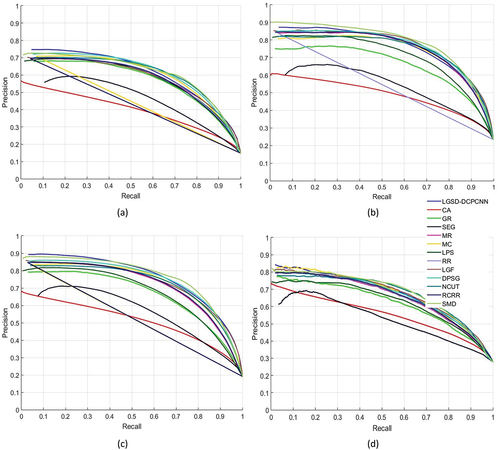
Figure 8. Quantitative analysis of the proposed algorithm based on the ROC curve on four benchmark saliency detection datasets (a)DUT-OMRON (Yang et al. Citation2013) (b)ECSSD (Shi et al. Citation2015) (c)HKUIS (Li and Yu Citation2015) (d)SOD (Movahedi and Elder Citation2010).
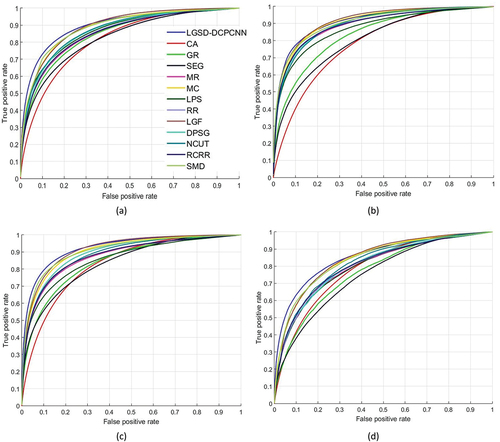
Table 5. Quantitative analysis of the proposed algorithm with other saliency detection techniques based on the MAE, F-measure (Fm) and AUC values on four benchmark saliency detection datasets. (Red, green, and blue highlight the three leading models, respectively.) MAE less is better, AUC and Fm more is better.
Table 6. Quantitative analysis of the proposed algorithm with deep learning based saliency detection techniques based on the MAE and AUC values on four benchmark saliency detection datasets. (Bold values show the best outcome, AUC higher is better and MAE lower is better)
Figure 9. Qualitative analysis of the proposed algorithm compared to other deep learning based salient object detection techniques (a)Original Image (b)Groundtruth (c)KSR (d)HRSOD-DH (e)PAGR (f)EGNet-R (g)RSD-R (h)LGSD-DCPCNN.
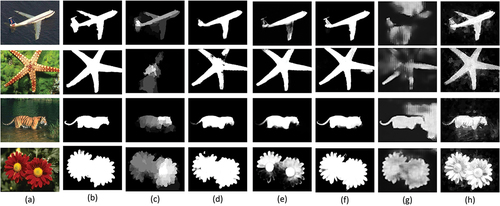
Figure 10. Comparative results using F-measure curve on the HKUIS dataset for features selection of global saliency map generation.
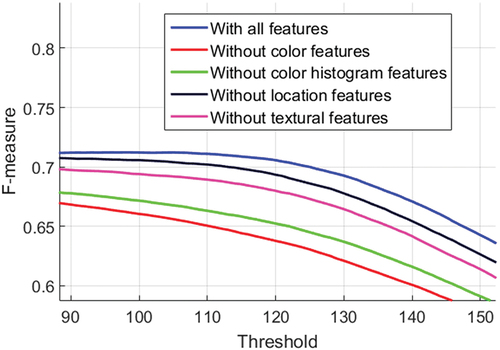
Figure 11. The proposed method’s visual output when baseline saliency maps produce poor results. (a)original image (b)GT (c)global saliency map (d)LGSD-DCPCNN.