Figures & data
Figure 1. Recurrent neural network cell structure (Ozbayoglu, Gudelek, and Sezer Citation2020).
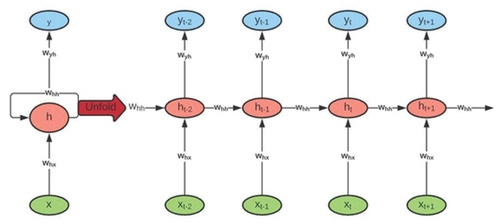
Figure 2. Long short-term memory cells (Ozbayoglu, Gudelek, and Sezer Citation2020).
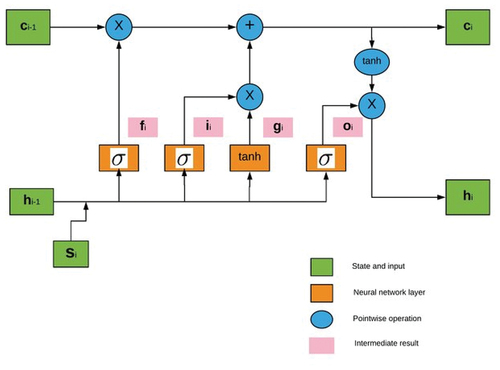
Figure 3. Convolutional neural network structure (Albelwi and Ausif Citation2017).
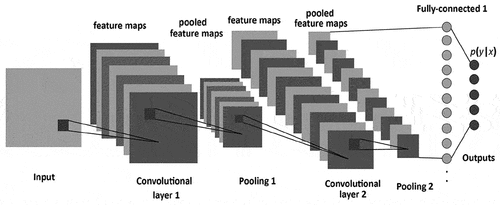
Table 1. A comparative study of state-of-the-art of deep learning model for stock market prediction.
Table 2. Loss of neural network models.
Figure 4. Validation Loss of LSTM model using Relu activation function.
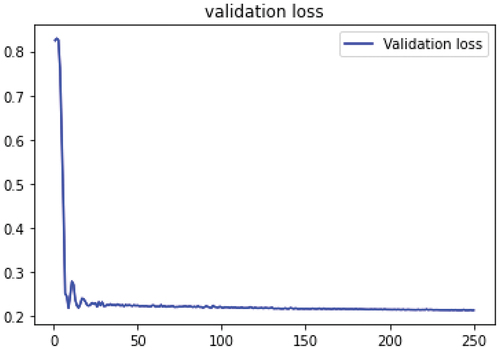
Table 3. Error value for LSTM training set.
Figure 5. Real value vs Predicted value for NIFTY 50 using RNN .
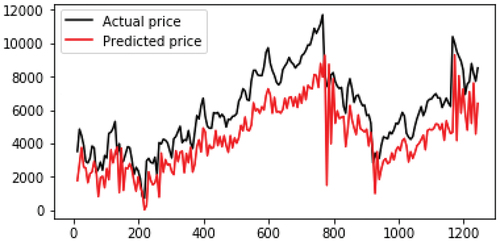
Table 4. Error value for LSTM testing set.
Table 5. Error value for RNN training set.
Table 6. Error value for RNN testing set.
Table 7. Error value for CNN training set.
Figure 6. Real value vs predicted value for NIFTY 50 using LSTM .
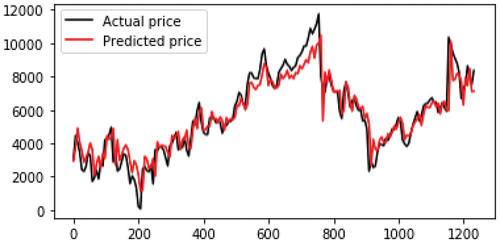
Figure 7. Prediction of close price using RNN.
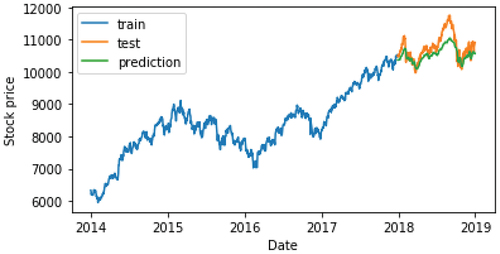
Figure 8. Prediction of close price using CNN.
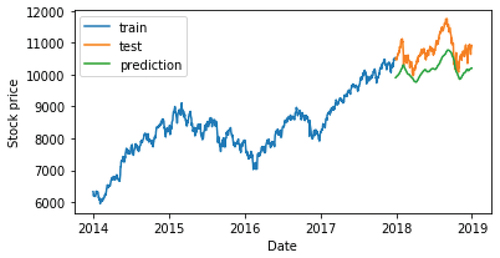
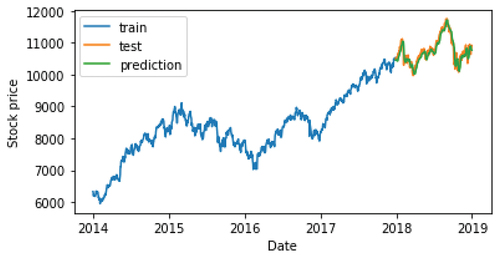
Figure 9. Prediction of close price using LSTM.