Figures & data
Figure 1. Schematic diagram to reflect the flow of work.
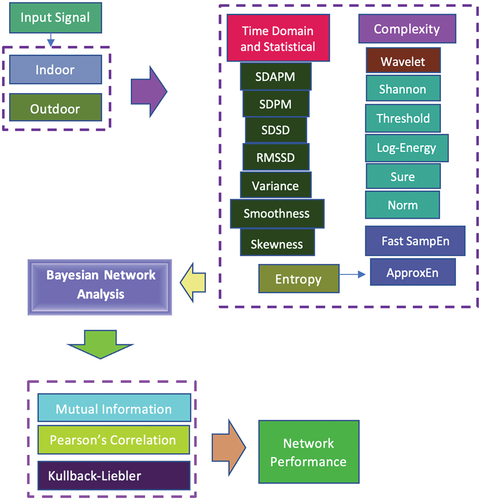
Figure 2. Feature ranking based on entropy values.
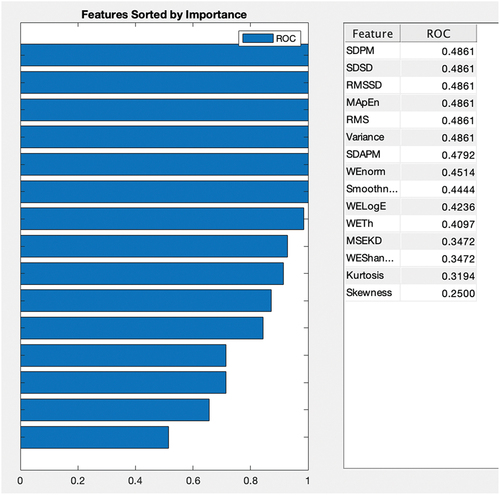
Figure 3. Relationship analysis using different Bayesian inference approaches such as (a) mutual information (MI), (b) Kullback–Leibler (KL) divergence, and (c) Pearson’s correlation by applying the unsupervised learning using maximum spanning tree and selecting SDPM as our target node.
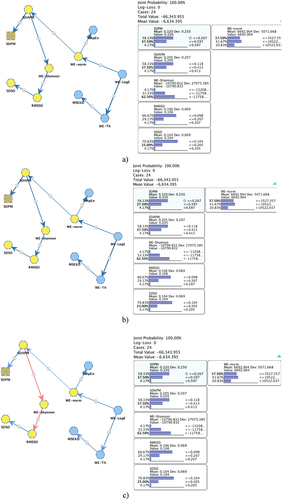
Table 1. Parent–child relationship on extracted multimodal features to distinguish the particulate matter (indoor and outdoor) time series using mutual information (MI), Kullback–Leibler (KL) divergence, and Pearson’s correlation.
Figure 4. Arc analysis 3D mapping to determine the relationship among the nodes: (a) mutual information, (b) Kullback–Leibler (KL) divergence, and (c) Pearson’s correlation.
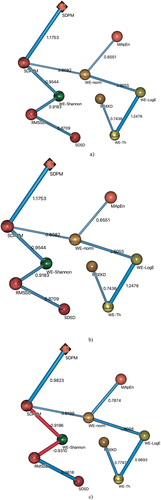
Table 2. Node force of extracted multimodal features from particulate time-series data.
Table 3. Analysis of target node SDAPM with other extracted nodes.
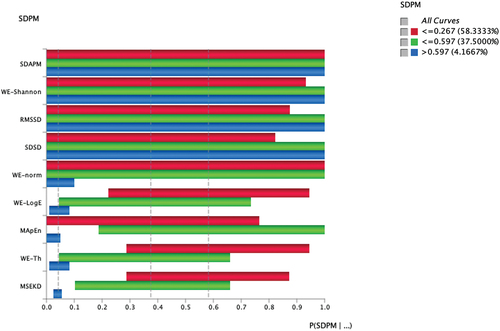
Figure 5. Analysis of target node energy with other extracted nodes using mosaic graph based on selected target node SDPM and predictions of occurrence made against each state ≤0.267, ≤0.597, and >0.59.
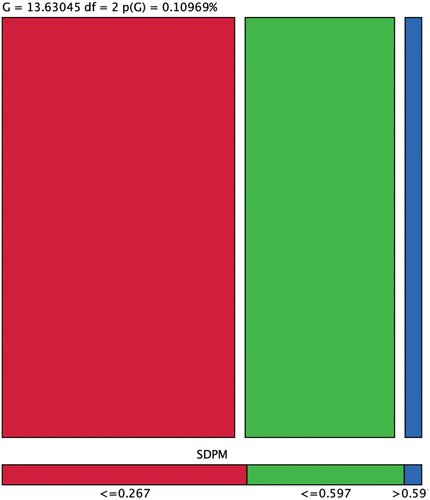
Table 4. Overall analysis of target node SDAPM with other extracted multimodal features.
Figure 6. Association graph of segment profile analysis of SDAPM node with other extracted multimodal features using radar chart graph at different selected states: (a) overall and overall with selected states (b) ≤ 0.267, (c) ≤0.597, and (d) >0.597; overall with (e) all selected states.
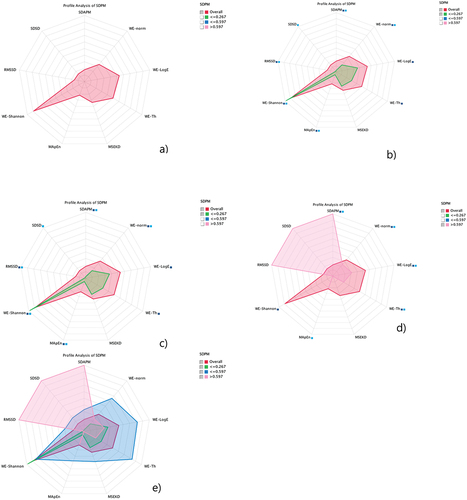
Figure 7. Network performance target evaluation SDAPM node with other selected nodes: (a) Occurrence, reliability, and precision report; (b) gain report of state ≤0.267; and (c) ROC index of state ≤0.267.
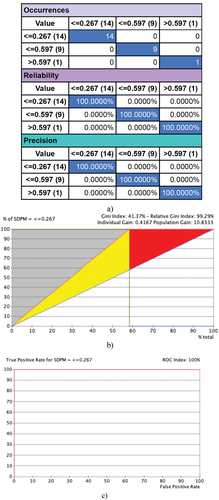
Figure 8. Tornado diagram of posterior probabilities to compute the significance of SDAPM node with all nodes at selected cluster states (≤0.267, ≤0.597, and > 0.597).