Figures & data
Figure 1. Filter cake from BSBMDIF (a), Chemical Breakers; EDTA (b), SiO2 (c) (Wayo Citation2022).
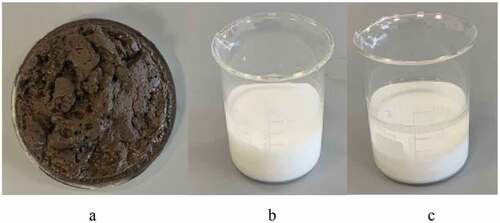
Figure 2. Detachment of particles from strands (Puderbach, Schmidt, and Antonyuk Citation2021).
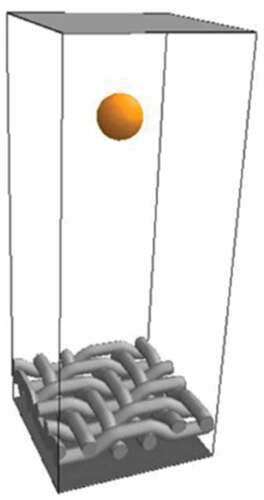
Table 1. Influence of EDTA and SiO2 on return permeability (Wayo Citation2022).
Table 2. Composition of filter cake buildup (Biodegradable Synthetic-Based Mud DIF) (Wayo Citation2022).
Figure 3. Experimental flow procedure to attaining data (Wayo Citation2022).
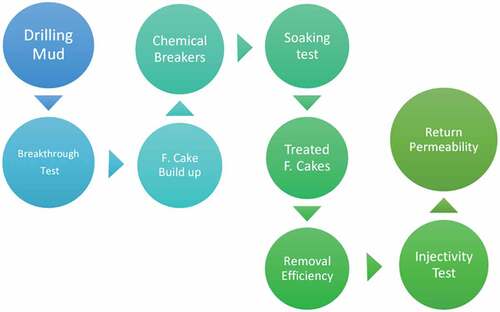
Figure 4. CFD algorithm.
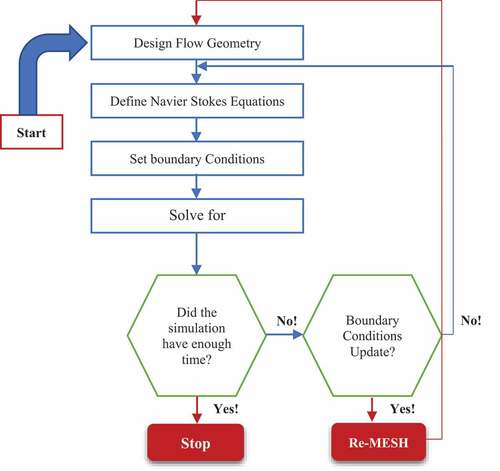
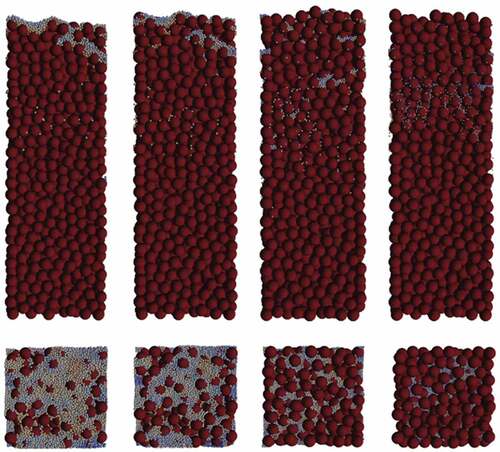
Figure 5. Field and Laboratory illustration of slurry invasion/filter cakes (Shehadeh et al. Citation2021).
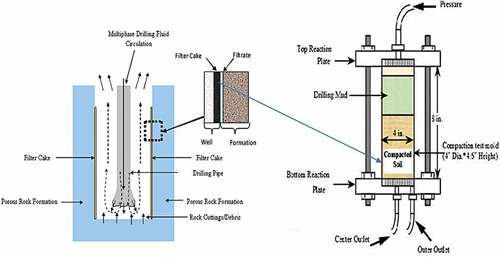
Table 3. Sampled drilling fluid’s rheology for cake buildup (Wayo Citation2022).
Table 4. Chemical breakers (Wayo Citation2022).
Table 5. Barite rheology (Rabbani and Salehi Citation2017).
Table 6. Rabbani’s fluid particle size distribution (Rabbani and Salehi Citation2017).
Table 7. Mud and breaker particle sizes.
Figure 6. Laboratory materials for return permeability (a) Salehi’s geometry model (b) Current geometry and flow navigation (c).
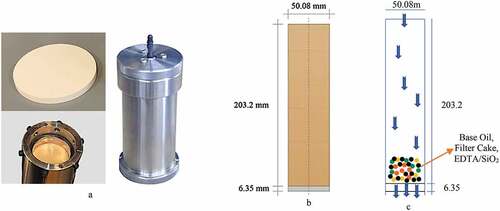
Figure 7. Geometry (a), Mesh (b), Boundary (c).
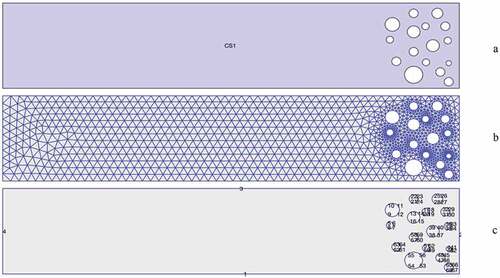
Figure 8. Probable mechanical dispersion of particles considered for simulation (Rabbani and Salehi Citation2017).
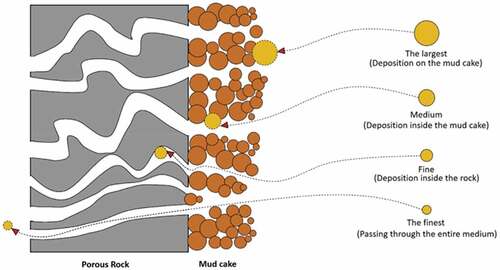
Figure 9. Filtration volume over time.
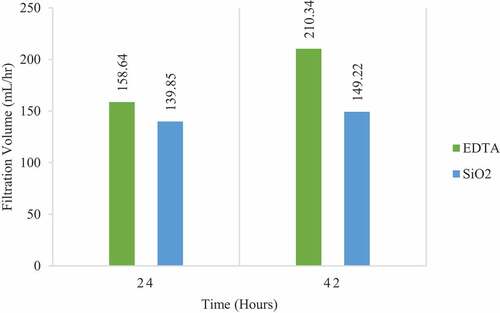
Figure 10. Quantum of filtration predicting rate of permeability.
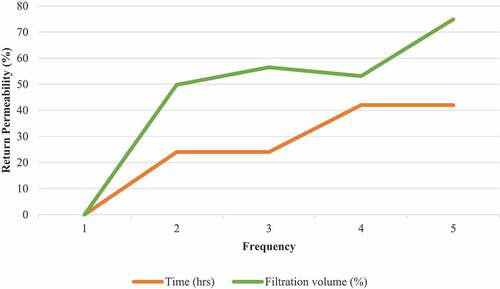
Figure 11. Filter cake thickness under comparative models.
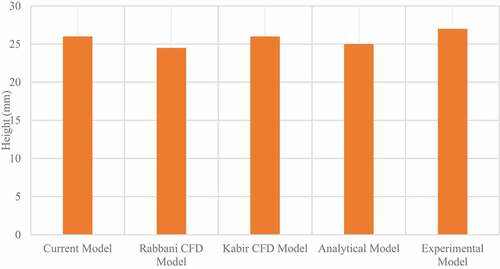
Figure 12. Barite particle distribution (a) (Rabbani and Salehi Citation2017). Filtration of barite particles in shallow and deep wells (b) (Kabir and Gamwo Citation2011).
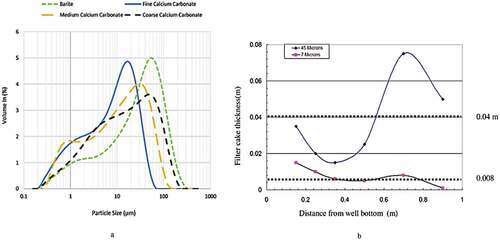
Figure 13. Particle sizes in simulation to determine permeability return.
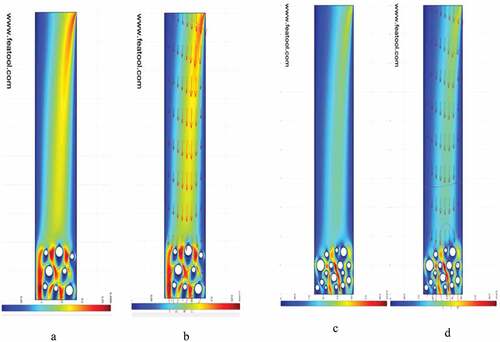
Figure 14. Particle sizes and dispersion (Feng et al. Citation2020).