
Figures & data
Figure 1. Schematic diagram of the FCOS prediction results.
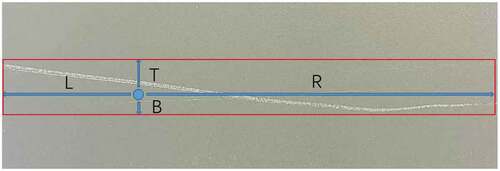
Figure 2. FCOS network structure diagram.
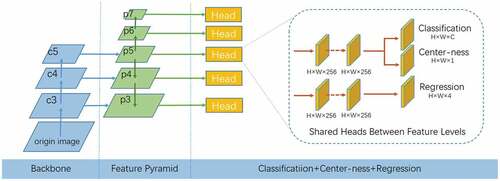
Figure 3. Schematic diagram and the center-ness heatmap of an elongated defect (a) Schematic diagram of elongated defects (b) Heatmap of the original center-ness (c) Heatmap of the improved center-ness.
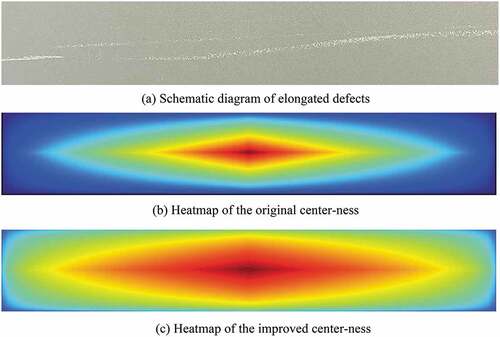
Figure 4. Advanced FCOS structure.

Figure 5. Schematic of center sampling and self-adaptive center sampling. (a) Original FCOS sampling. (b) Center sampling. (c) Self-adaptive center sampling.
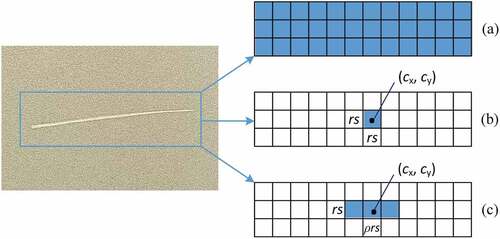
Figure 6. Schematic of defects. (a) Scratches, (b) spots (size defects), (c) wrinkles, and (d) bumps.
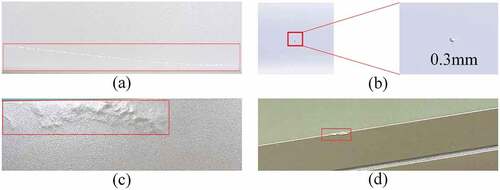
Figure 7. Loss curve.
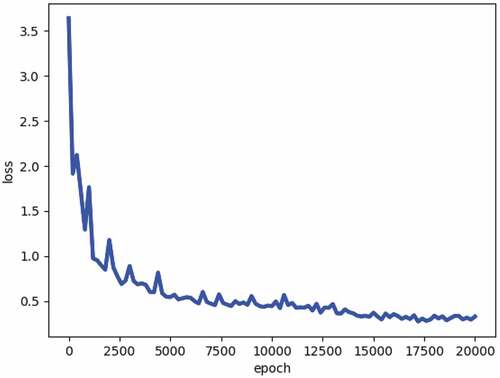
Table 1. Comparison of the IoU loss and GIoU loss (√ denotes that the AP was improved after introducing the GIoU loss).
Table 2. Comparison of the effects of batch normalization and group normalization.
Table 3. Comparison of the experimental results of the improved center-ness and original center-ness.
Table 4. Analysis of experimental results for self-adaptive center sampling and center sampling.
Figure 8. Visualization of the detection results, where defects 1 to 4 represent scratches, spots, wrinkles, and bumps, respectively.
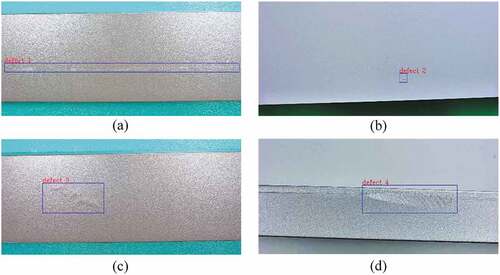
Table 5. Comparison of experimental results of the five-stage model.
Figure 9. Scatter plot of size distribution of defects in the dataset.
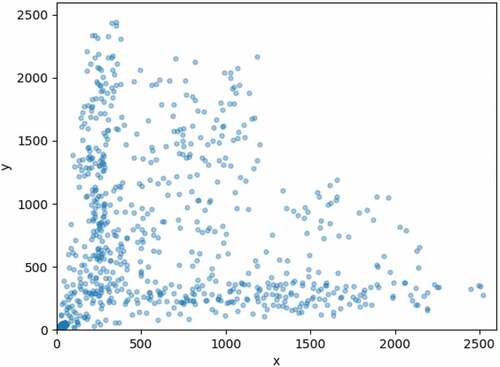
Figure 10. Schematic diagram of the change in the bounding box when the angle of an elongated defect changes.
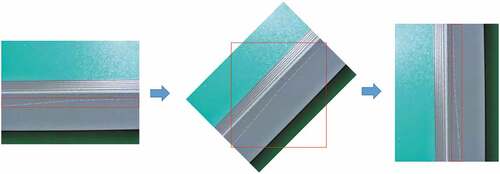
Figure 11. Comparison of the scratch detection results for (a) Faster R-CNN detection, (b) YOLOv3 detection, (c) YOLOv5x detection and (d) our model.
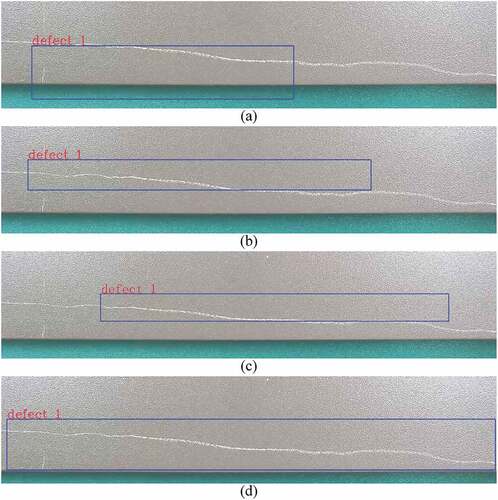
Table 6. Comparison of the AP values of the three models.
Table 7. Comparison of the detection speeds of the three models.