
Figures & data
Figure 1. (a) Plant image taken using LemnaTec facility covers not only the plant parts but also the other parts of the chamber, (b) cropped image to get the region of interest (plant parts), (c) ground truth segmented mask images corresponding to the cropped image.
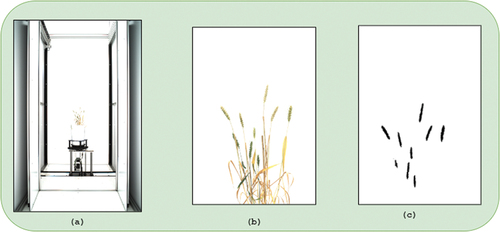
Figure 2. Architecture of Yield-SpikeSegNet consisting of spike detection and yield estimation module.
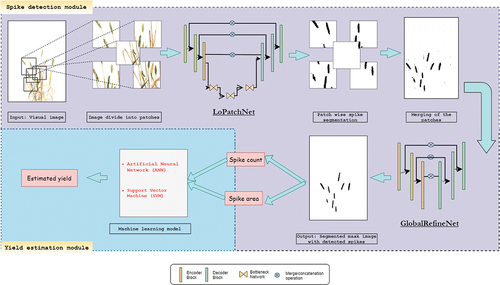
Figure 3. Training losses of (a) LoPatchExNet, and (b) GlobalPurifyNet.
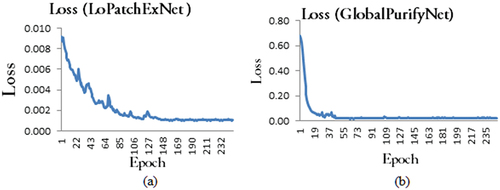
Table 1. Segmentation performance.
Figure 4. Fitted ANN model architecture.
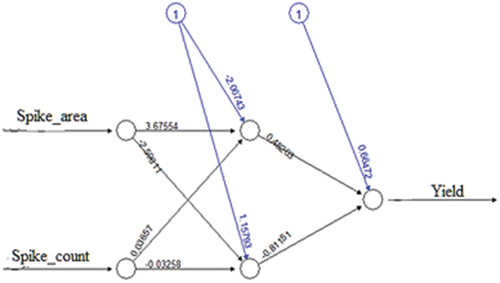
Table 2. Performance of ANN and SVR in training and testing dataset.
Table 3. Summary statistics of the hyper-parameters used in SVR model development.