
Figures & data
Table 1. Observations for particle swarm optimization algorithm.
Figure 1. Iteration vs Fitness graph of PSO.
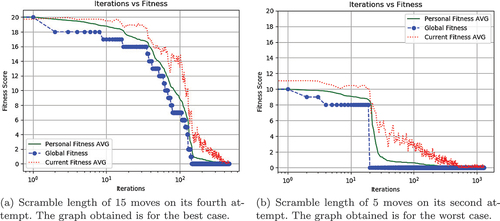
Table 2. Observations for greedy tree search algorithm.
Figure 2. Iteration vs Fitness graph of greedy tree search.
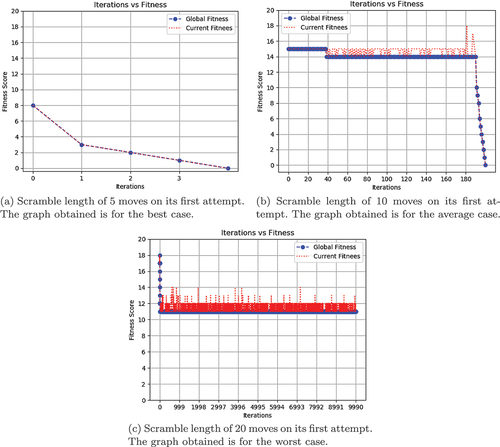
Table 3. Observations for ant colony optimization algorithm.
Figure 3. Iteration vs Fitness graph of ACO.
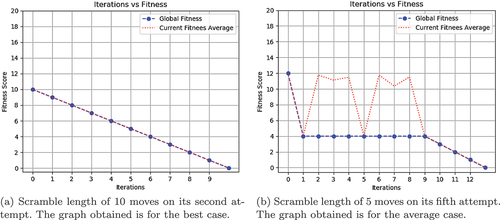
Table 4. Observations for discrete krill herd optimization algorithm.
Figure 4. Iteration vs Fitness graph of KHO.
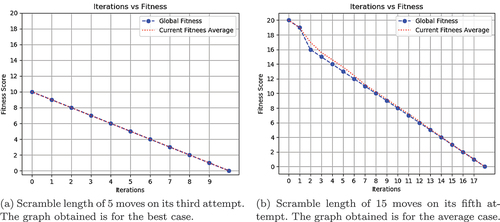
Table 5. Scrambles used for comparative analysis of the algorithms.
Table 6. Observations obtained from the comparative analysis of PSO, greedy tree search, ACO, and DKHO.
Table 7. Mean and standard deviation of the observations obtained from the comparative analysis of the algorithms.
Table 8. Number of times the evaluation function is called by the swarm intelligence algorithms.