
Figures & data
Figure 1. Map of Ghana showing the location of the study site.
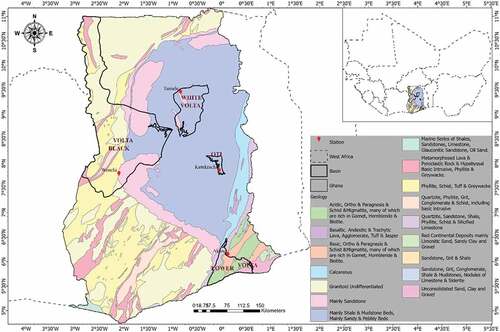
Figure 2. Conceptual diagram showing the structure of the study modified from (Toews Citation2007) and a typical framework for feed-forward neural network with the multi-layer perceptron (FFN-MLP) and extreme learning machine (FFN-ELM) models.
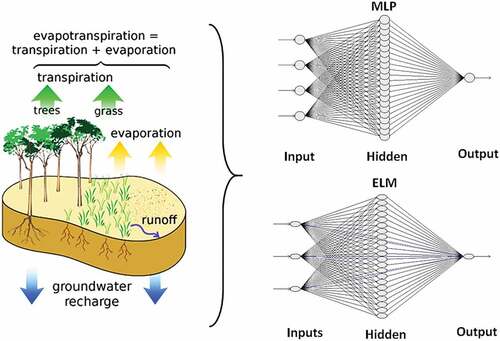
Table 1. Description of the daily climate data used in the four weather stations in the volta basin.
Figure 3. Average monthly rainfall and PET for the four studied stations.
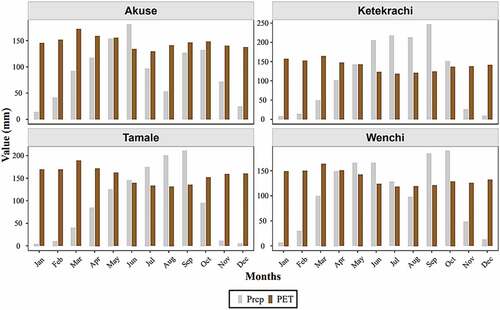
Table 2. Average annual potential evapotranspiration (PET), runoff, and groundwater (GW) recharge (mm) and their percentages to the average annual precipitation (P). DR refers to direct runoff.
Figure 4. Training and prediction of FFN-MLP and FFN-ELM using observed GW recharge data at Akuse, Ketekrachi Wenchi, and Tamale.
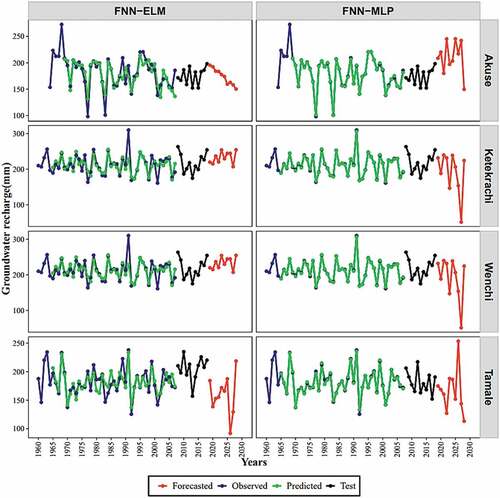
Figure 5. Correlation between observed and predicted GW recharge in selected stations in Ghana.
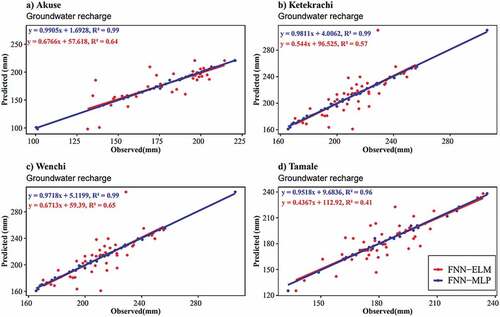
Table 3. Summary statistics of observed and predicted GW recharge for the four studied stations in Ghana.
Table 4. Comparison of estimated annual GW recharge in the study and prior studies. The comparison was done using absolute estimates and ratios to rainfall estimates.