
Figures & data
Figure 1. SDN architecture of a transport IoT environment.
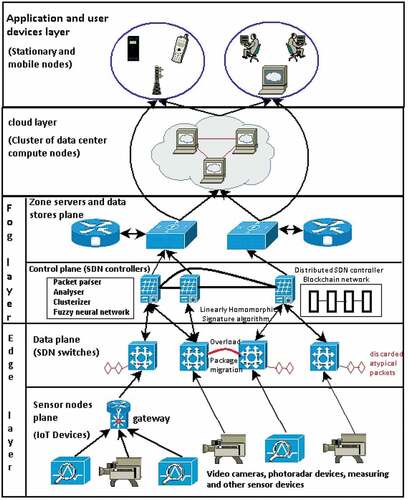
Figure 2. Subsystem for analysis and detection of atypical data packets.
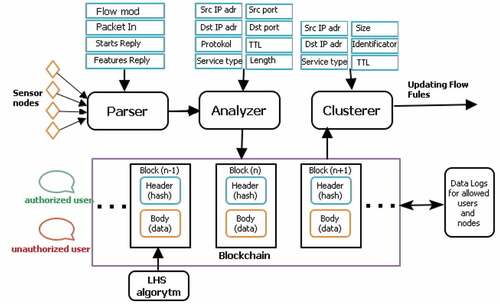
Figure 3. Architecture of fuzzy neural network.
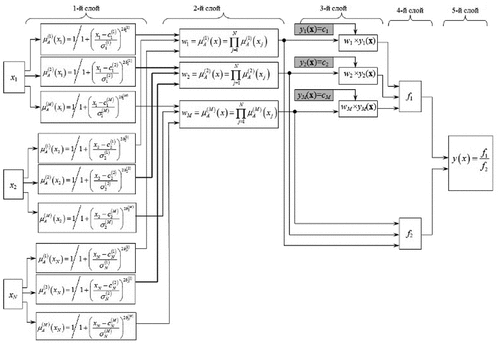
Figure 4. Diagrams of the dependence of the delay on the number of sensor nodes and the number of packets.
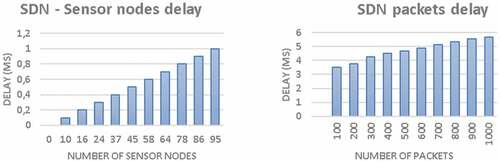
Figure 5. Comparison of the response time of a traditional SDN network and an SDN network with an HNS and an LHS algorithm.
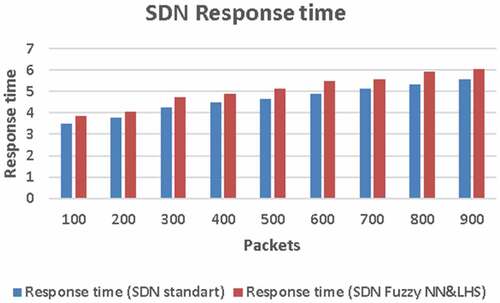
Figure 6. Comparison of throughput in SDN network with traditional architecture and in SDN network with HNS and LHS algorithm.
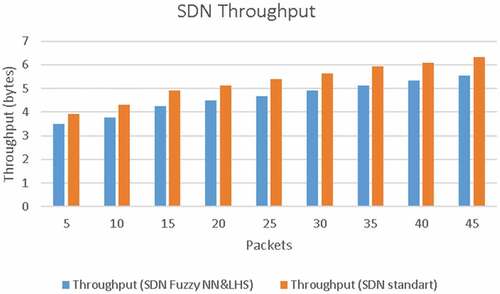
Table 1. Atypical packet detection accuracy.