Figures & data
Figure 1. The process of text classification.
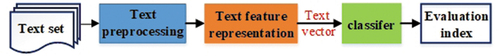
Figure 2. The overall model architecture.
Figure 3. Paraphrasing.
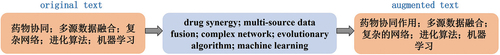
Figure 4. Mixup.
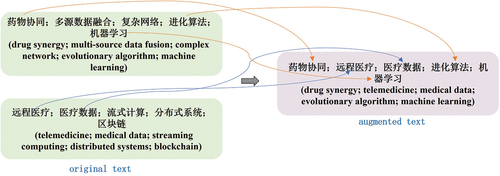
Figure 5. Generating data by GPT-3.
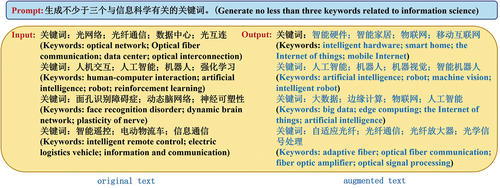
Table 1. Partial experimental data set.
Figure 6. The reduced categories and corresponding quantity. (IS: Information Science, CS: Chemical Science, MS1: Medical Science, ES: Earth Science, EMAS: Engineering and Materials Science, MS2: Mathematical Science, LS: Life Science, MS: Management Science).
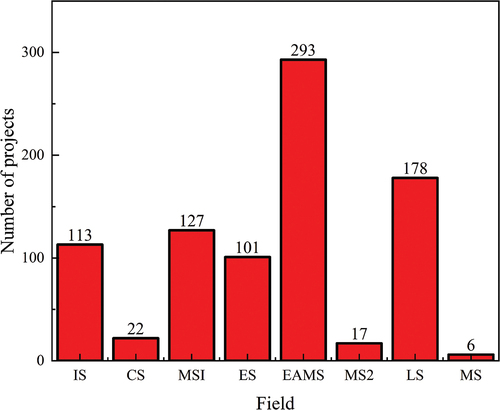
Table 2. Partial experimental data set after merging categories.
Table 3. Confusion matrix of the classification result.
Table 4. Performance of the different models.
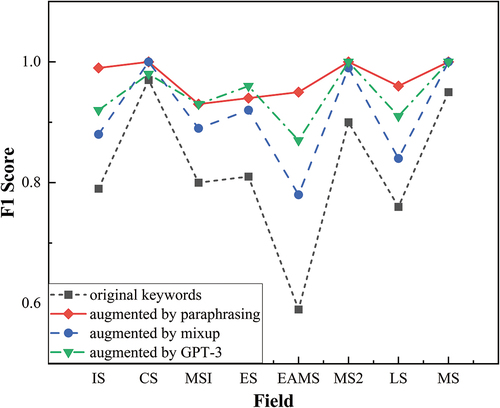
Figure 7. F1-score corresponding to each category. (IS: Information Science, CS: Chemical Science, MS1: Medical Science, ES: Earth Science, EMAS: Engineering and Materials Science, MS2: Mathematical Science, LS: Life Science, MS: Management Science).
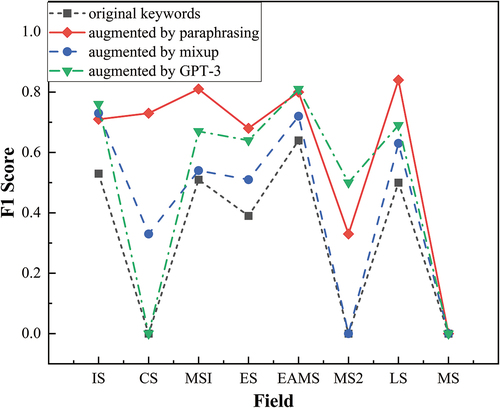
Table 5. Performance of the different models.
Figure 8. F1-score corresponding to each category after introducing SMOTE. (IS: Information Science, CS: Chemical Science, MS1: Medical Science, ES: Earth Science, EMAS: Engineering and Materials Science, MS2: Mathematical Science, LS: Life Science, MS: Management Science).