Figures & data
Figure 1. Flow chart of study participants.
Table 1. Checkup variables under study.
Figure 2. Machine learning model architecture: (a) Logistic regression; (b) naïve bayes; (c) support vector machine; (d) random forest; (e) extremely randomized tree (f) extreme gradient boosting; (g) light gradient boosting machine; (h) multilayer perceptron.
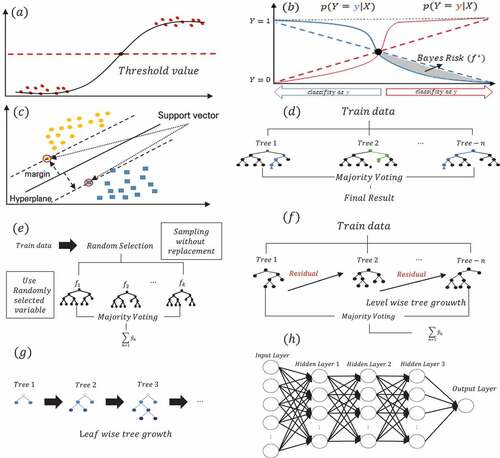
Table 2. General characteristics of two datasets in the study design.
Figure 3. Odds ratio plot for statistically significant features. Plot (a) displays the probability of developing prediabetes from normal as one unit of each feature increases and Plot (b) displays the probability of developing diabetes from prediabetes as one unit of each feature increases.
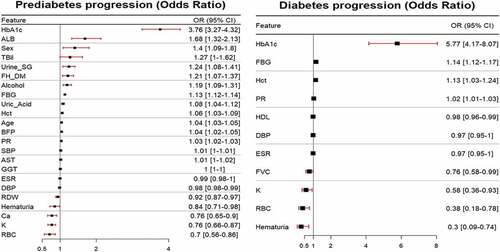
Table 3. The top-10 ranked variables by permutation feature importance for each ML in two datasets.
Table 4. Variable ranking for all 8 models by permutation feature importance.
Figure 4. Feature selection through Boruta algorithm.
Table 5. The variable selected Boruta, SelectKbest, Lasso method.
Table 6. The performance measure of each classification algorithm.
Figure 5. Violin plot. (a) prediabetes progression (b) diabetes progression associated with FBG, HbA1c, Hct.
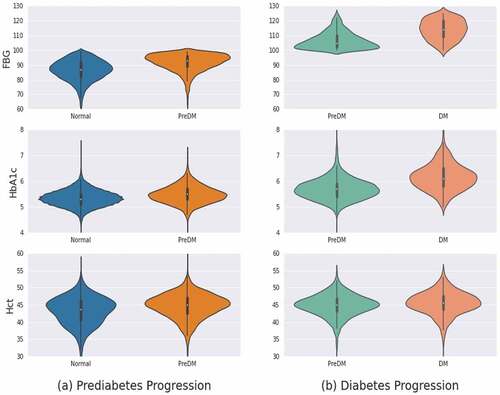
Figure 6. Confusion matrix. (a) prediabetes progression; (b) diabetes progression through each machine learning algorithm.
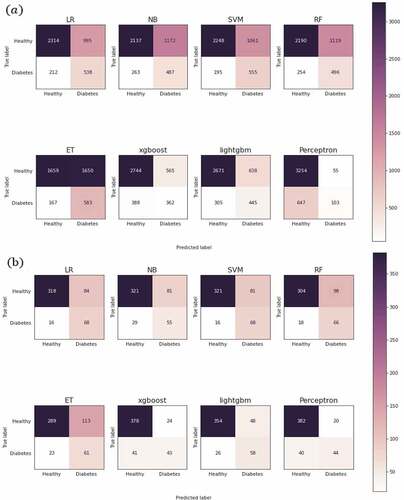
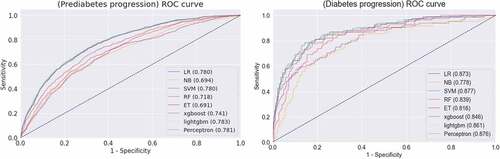
Figure 7. ROC curve (a) prediabetes progression, plot (b) diabetes progression through each machine learning algorithm.