
Figures & data
Table 1. Analysis of YOLOV5 about related studies.
Figure 1. A Proposed i-YOLOV5 Model for BT Detection to Feature Extraction.
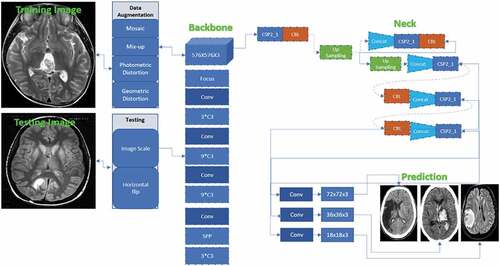
Figure 2. Enhancement approach of Mosaic Image Processing.
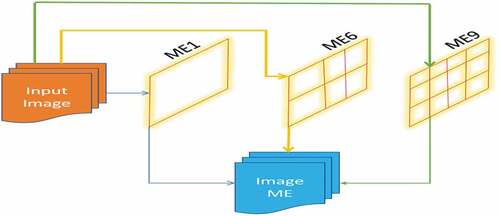
Figure 3. Bounding Box Prediction with tumor specifications.
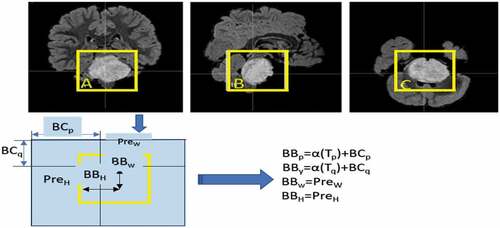
Figure 4. Ground Truth Test for Brain Tumor Detection.
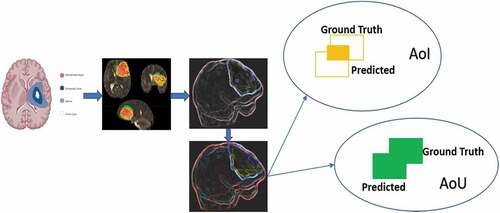
Figure 5. The proposed i-YOLOV5 model for Brain Tumor Detection.
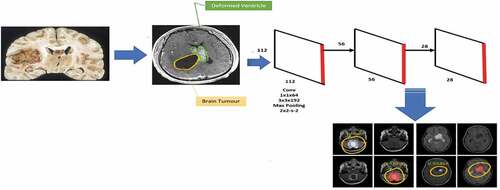
Table 2. Optimal Hyper Parameters of proposed YOLOV5.
Figure 6. Segmented Lesion Zone of Input Image.
Figure 7. Quantitative measurements of the optimization method.
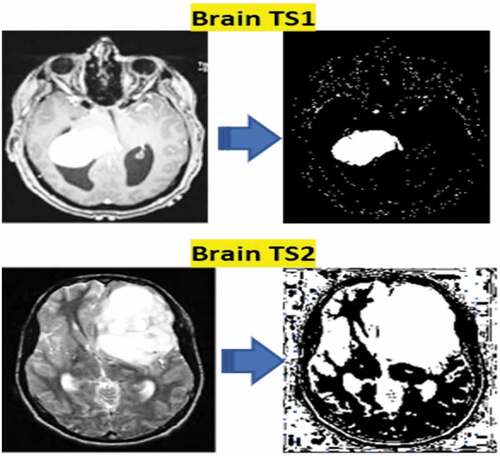
Table 3. Recognition Speed at Different Resolutions.
Figure 8. Confusion matrix of comparison ML techniques.
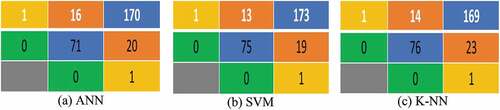
Figure 9. Performance Measures on Multiple Frequency Bands.
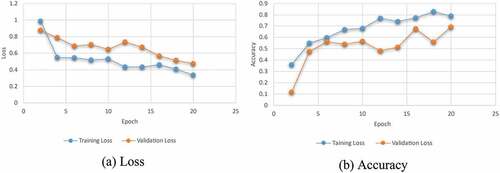
Table 4. ML Algorithm comparison using F1-score and Accuracy.
Figure 10. Grid Output for Convolutional Layer Activations for Classification.
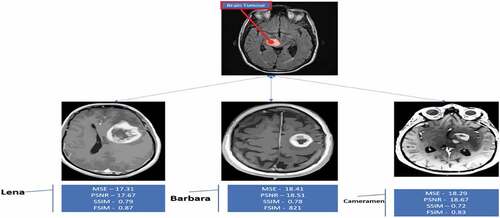
Table 5. Performance Metrics of Image Quality (MSE, PSNR, SSIM, FSIM).
Table 6. Performance measure of MSE, PSNR, SSIM, FSIM, CPU Time.
Figure 11. The performance measures of mAps of i-YOLOV5 iterations.
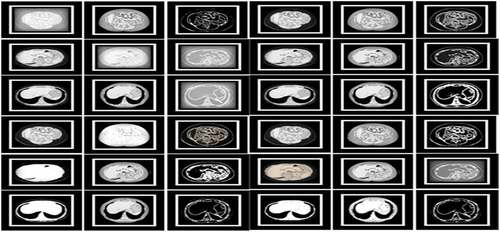
Table 7. Learning models of the CNN Models.
Figure 12. Localization Results of Input Images with Localization Values.
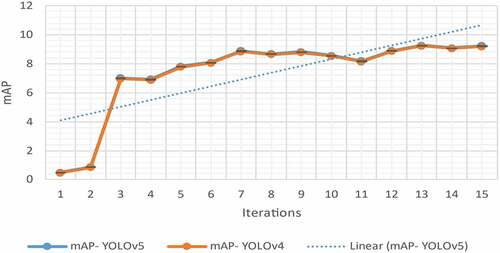
Figure 13. Loss and Accuracy graph of BT detection.
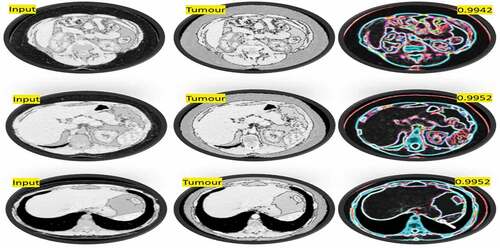
Table 8. Localization of Proposed Method.
Figure 14. ROC Curve for proposed i- YOLOV5.
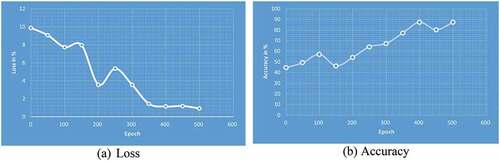
Figure 15. Confusion Matrix of BT classification using proposed model.
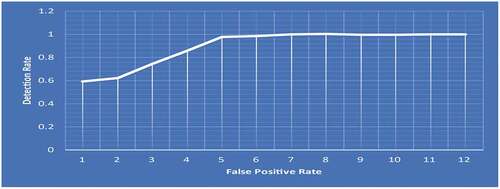
Table 9. Analysis of Accuracy metrics of TP, TN, FP, FN, Accuracy, Specificity, Sensitivity, and Precision.
Figure 16. Confusion Matrix of BT classification using proposed model.
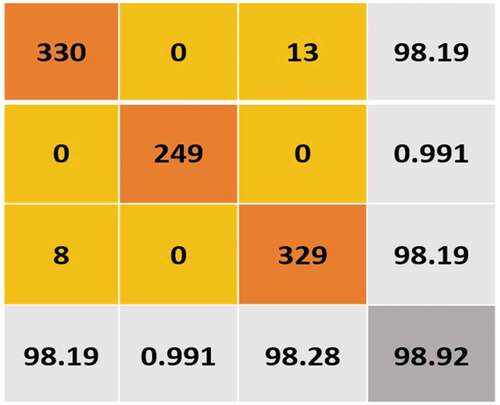
Figure 17. Performance measure of Proposed model vs other models.
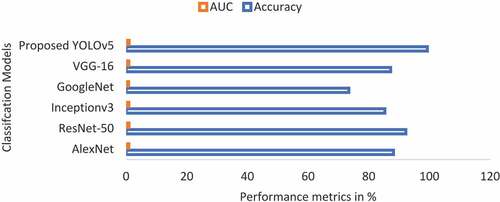
Table 10. Comparison of classification performance between proposed and existing state-of-the-art techniques.
Table 11. Proposed (i-YOLOV5) BT detection with different losses on test datasets.
Table 12. The i-YOLOV5 is compared to other models by (Bernal et al. Citation2019).