
Figures & data
Figure 1. Examples of CT and MR abdominal organ images. (a) a CT image slice in axial view. (b) a T1-weighted sequence of MR image slice in axial view. (c) a T2-weighted sequence of MR image slice in axial view.
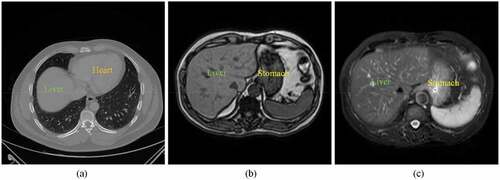
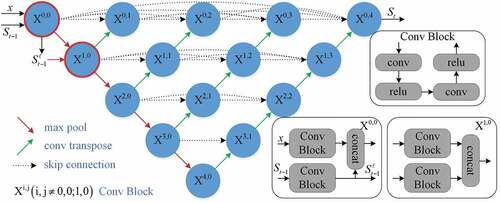
Figure 2. Network architecture.
Table
Figure 3. The training results of the 2D UNet++ and the proposed method over 80 epochs from (a) the 3Dircadb1 dataset, (b) the Sliver07 dataset, and (c) the CHAOS19 dataset.
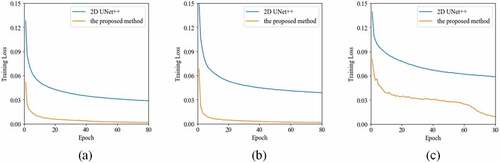
Figure 4. The boxplot of DICE results using four methods on CT images of three datasets. A star indicates a statistical significant difference of the median DICE compared to the previous column.
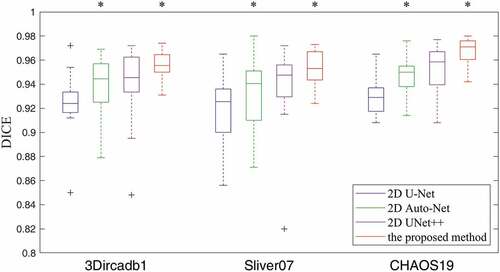
Figure 5. Typical liver segmentation results on CT images of the 3Dircadb1 (top row), the Sliver07 (middle row), and the CHAOS19 (bottom row) datasets by using four methods. (a) 2D U-Net. (b) 2D Auto-Net. (c) 2D UNet++. (d) the proposed method. Green contours indicate the ground truth segmentation, and red contours indicate the automatic segmentation by the algorithm.
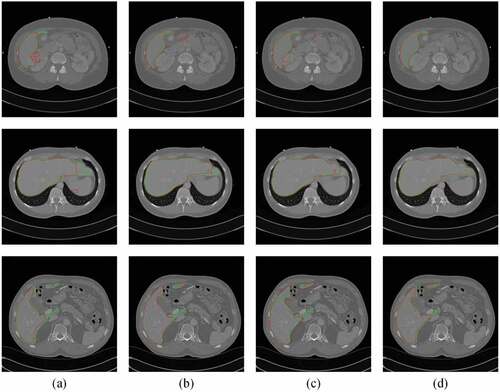
Table 1. The mean and standard deviation of quantitative measures for liver segmentation on three datasets.
Figure 6. The training results of the 3D UNet++ and the proposed method over 160 epochs from (a) the T1-DUALin sequence, (b) the T1-DUALout sequence, and (c) the T2-SPIR sequence.
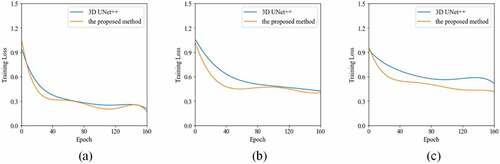
Figure 7. The boxplot of DICE results using four methods on multi-sequence MR images of the CHAOS19 dataset. A star indicates a statistical significant difference of the median DICE compared to the previous column.
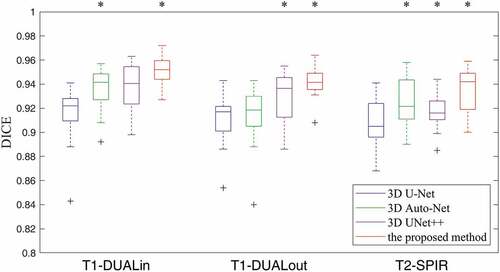
Figure 8. Typical liver segmentation results on MR images with the T1-DUALin (top row), the T1-DUALout (middle row), and the T2-SPIR (bottom row) sequences by using four methods. (a) 3D U-Net. (b) 3D Auto-Net. (c) 3D UNet++. (d) the proposed method. Green contours indicate the ground truth segmentation, and red contours indicate the automatic segmentation by the algorithm.
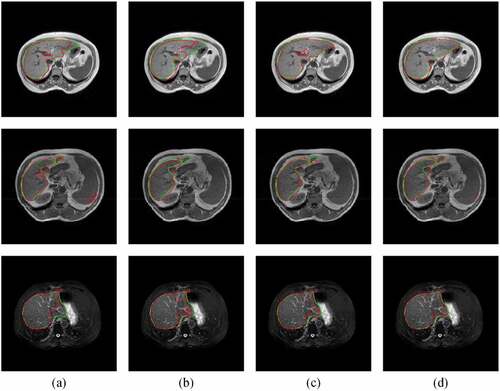
Table 2. The mean and standard deviation of quantitative measures for liver segmentation on multi-sequence MR images of the CHAOS19 dataset.
Table 3. The overall quantitative results of liver segmentation on CT and MR images as mean by using the Transformer-based methods and the proposed method.
Table 4. The overall quantitative results of liver segmentation on MR images as mean by using the proposed method with different scales.
Figure 9. The DICE results of liver segmentation on all CT images as mean by using four steps of the proposed method.
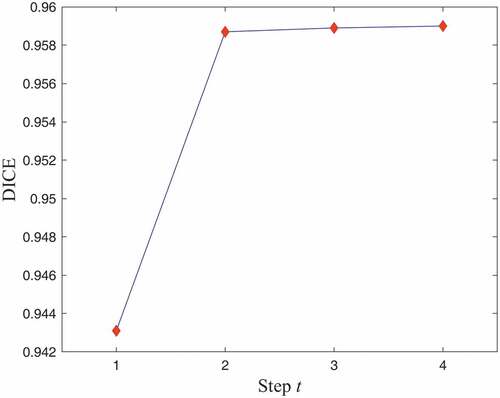
Table 5. The model complexity of different networks.