Figures & data
Figure 1. Multi-modal neural network architecture.
Table 1. Feature extractors for each data type. Numbers in the convolution brackets correspond to the number of feature maps and the kernel size, respectively.
Figure 2. Convolutional blocks of different CNN type.
Figure 3. Data instance of class Betula.
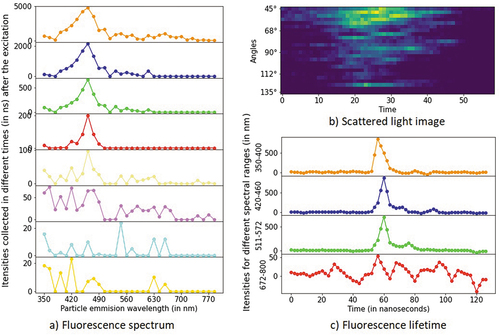
Figure 4. Number of data samples per class (abbreviations defined in the Labeled dataset subsection) before and after preprocessing. The y-axis is limited for visibility since classes Poaceae and spores have 82,143 and 157,753 samples before preprocessing, respectively.
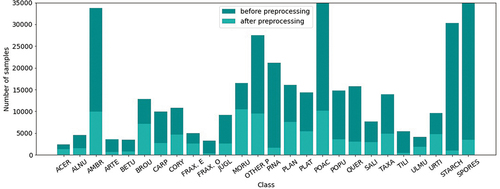
Figure 5. Number of parameters for each network and data type in a logarithmic scale.
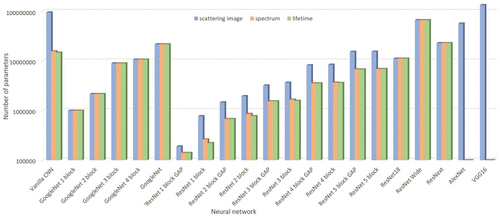
Table 2. Performances of the uni-modal networks.
Figure 6. F1 score of multi-modal networks for different training setups.
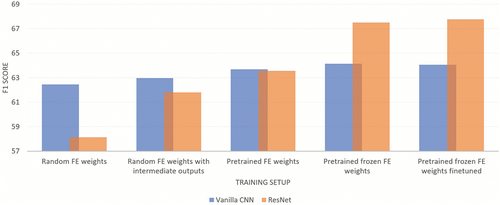
Figure 7. Confusion matrix of the best-performing multi-modal network.
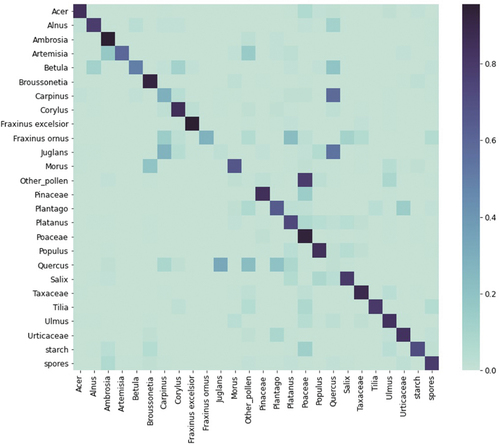
Figure 8. The average fluorescence spectrum data with standard deviation for Carpinus, Juglans, Quercus, and Taxaceae.
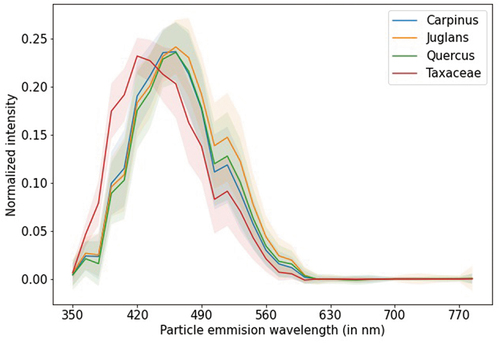
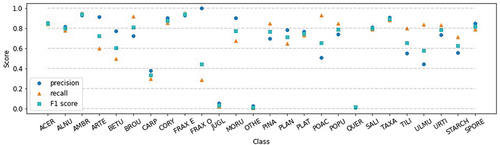
Figure 9. Precision, recall, and F1 score for each class (abbreviations defined in the Labeled dataset subsection).