
Figures & data
Figure 1. Process steps. In the first step, several features sets V* are calculated and concatenated. In the second step, the different feature sets are passed through a dimensionality reduction process, in which the number of feature sets V* are then concatenated to form a single feature set VR. In the last step, the resulting feature set VR is then passed to a density-based clustering process. The resulting clusters are then labeled using the TF-IDF algorithm. The goal of this step is to produce a reduced but reliable labeled dataset.
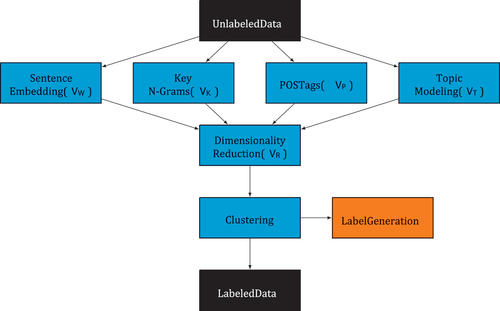
Figure 2. F1-score calculated using random forest on ATIS dataset for all feature sets combinations.
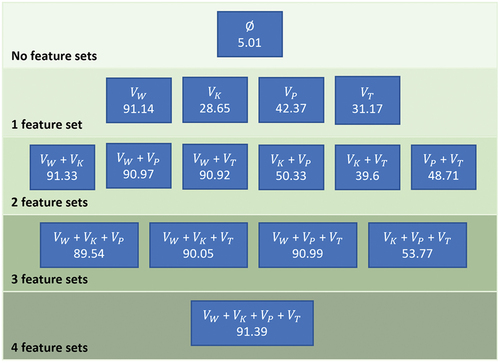
Table 1. Contribution of each feature set to the F1-score in absolute values. VW outperforms all the other feature sets.
Table 2. F1-score comparison on the different ways of calculating VW. fine tuned models outperforms pretrained models. Max pooling and CLS token yield better result than mean pooling.
Table 3. Clustering comparison. Iterative clustering method with other existing algorithms generally outperforms the rest. Depending on the complexity of the dataset, the performance difference varies. Simpler datasets such as SNIPS do not show any significant difference. Therefore, depending on the problem complexity, it might make sense to use one or another.
Table 4. Framework results. Features columns indicate the feature sets that were selected. For VW it indicates the pooling approach. Dim. Reduction and clustering columns indicate the methods and hyperparameters used in the dimensionality reduction and clustering steps, respectively. Results column summarizes AMI and V-measure score, number of clusters found and percentage of points assigned a label.
Table 5. Generated labels for SNIPS dataset.
Table 6. Generated labels for ATIS dataset.