
Figures & data
Figure 1. Schematic diagram to reflect the flow of work to detect lung cancer using XGBoost algorithm and deep learning ResNet101 with hyperparameter tuning.
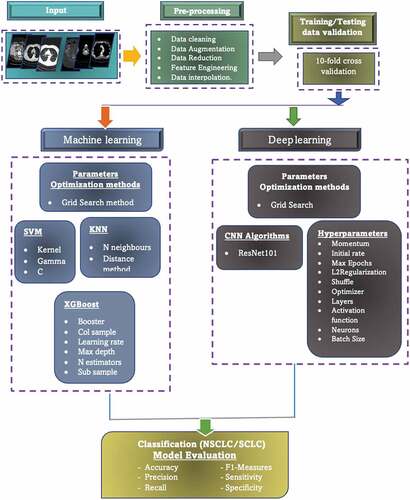
Figure 2. General architecture of XGBoost algorithm.
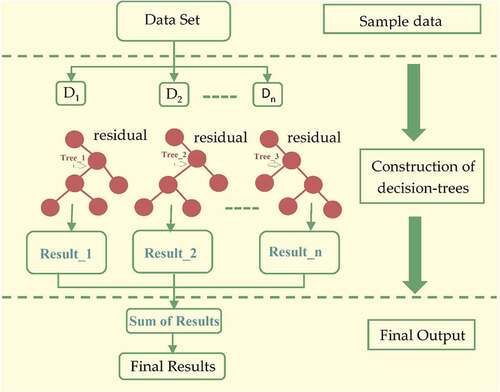
Figure 3. Lung cancer NSCLC and SCLC original image samples along with heatmaps.
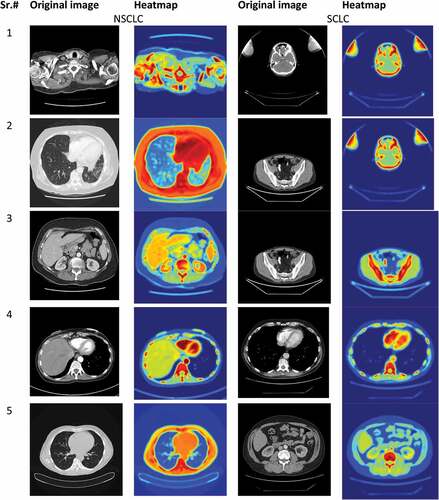
Table 1. Binary (NSCLC, SCLC) classification using traditional ML SVM algorithm with 10-fold cross validation.
Table 2. Binary (NSCLC, SCLC) classification using traditional ML KNN algorithm with 10-fold cross validation.
Table 3. Lung cancer detection performance utilizing XGBoost with default parameters.
Table 4. Lung cancer detection performance utilizing XGBoost with hyperparameters optimization.
Figure 4. AUC-ROC and error graph to detect the lung cancer using XGBoost.
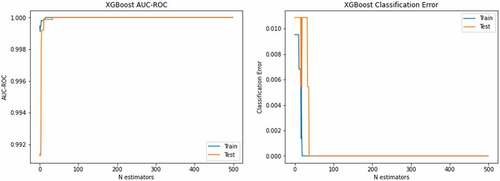
Figure 5. ROC and PR curves to detect lung cancer.
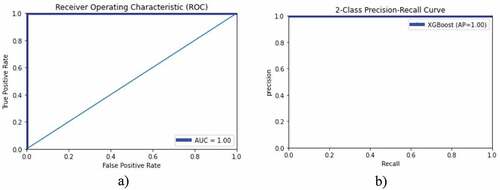
Figure 6. Accuracy-loss graph for binary (NSCLC, SCLC) classification: (a) accuracy graph, (b) loss graph using ResNet101 model with 10-fold cross validation.
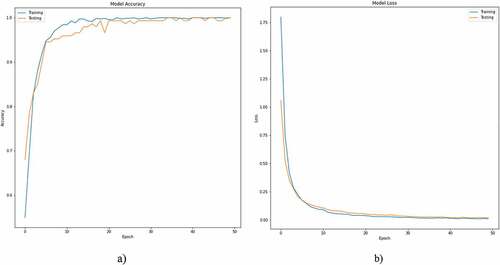
Table 5. Binary-class (NSCLC, SCLC) classification using ResNet101 model with 10-fold cross validation.
Table 6. Binary (NSCLC, SCLC) classification using ResNet101 model at selected twofold cross validation.
Table 7. Binary (NSCLC, SCLC) classification using ResNet101 model at selected fourfold cross validation.
Table 8. Binary (NSCLC, SCLC) classification using ResNet101 model at selected eightfold cross validation.
Table 9. Bacterial lung cancer detection performance utilizing XGBoost using optimized hyperparameters.
Figure 7. Confusion matrix for binary (NSCLC, SCLC) classification using ResNet101 model at different folds from 1 to 10 k-fold cross validation.
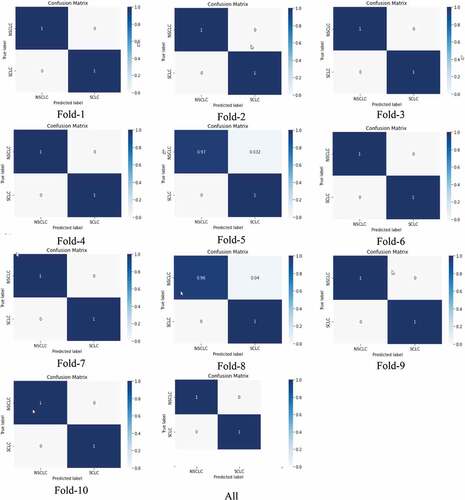
Figure 8. AUC-ROC and error graph to detect the bacterial lung cancer using XGBoost.
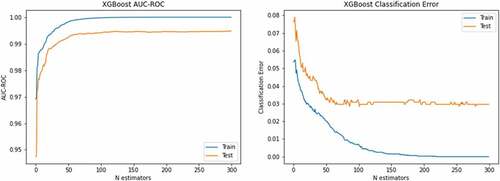
Figure 9. ROC and PR curves to detect bacterial lung cancer.
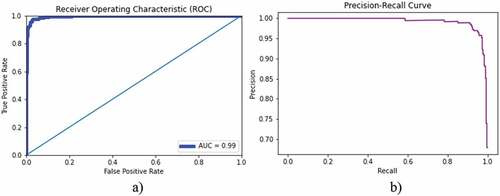
Table 10. Viral lung cancer detection performance utilizing XGBoost using optimized hyperparameters.
Figure 10. ROC and PR curves to detect viral lung cancer.
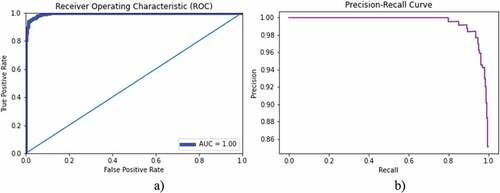
Table 11. Viral lung cancer detection performance utilizing ResNet101 with 10-fold cross validation.
Figure 11. Accuracy-loss graph for binary (viral, normal) classification: (a) accuracy graph, (b) loss graph using ResNet101 model with 10-fold cross validation.
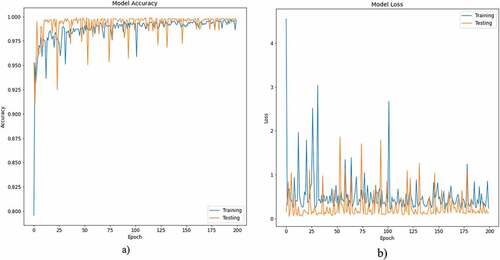
Table 12. Comparison of findings from previous studies.