
Figures & data
Figure 1. CLCNN’s model architecture.
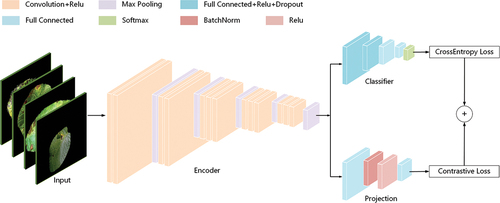
Figure 2. Examples of potato early blight and late blight in each period.
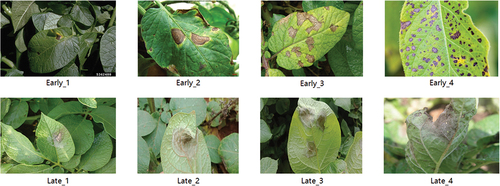
Table 1. Definition of disease period of potato early blight and late blight.
Table 2. Network structure of CLCNN’s encoder. represents the feature extractor and max pooling layer of Vgg16. Please refer to (Simonyan and Zisserman Citation2014) for the specific network structure of Vgg16.
Table 3. Network structure of CLCNN’s classifier. Vgg16** represents the classifier of Vgg16 that lacks the last fully connected layer. Please refer to (Simonyan and Zisserman Citation2014) for the specific network structure of Vgg16.
Table 4. Network structure of CLCNN’s projection head.
Table
Figure 3. Process of CLCNN’s experiments.
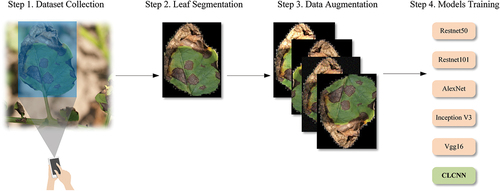
Figure 4. The experimental process of using Mask-RCNN to segment plant diseased leaves.
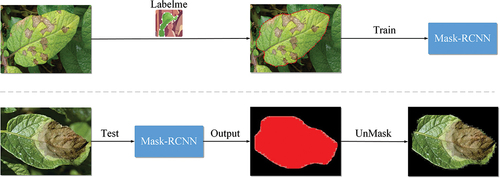
Figure 5. Six methods of data augmentation.
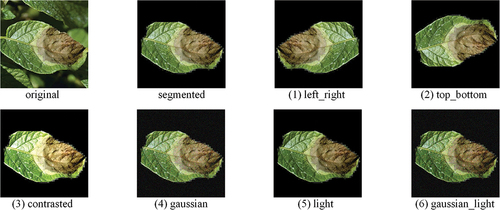
Table 5. Results of data augmentation.
Table 6. Hyperparameters of CLCNN. refers to EquationEquation 13
(13)
(13) .
Figure 6. Confusion matrix of the classification results.
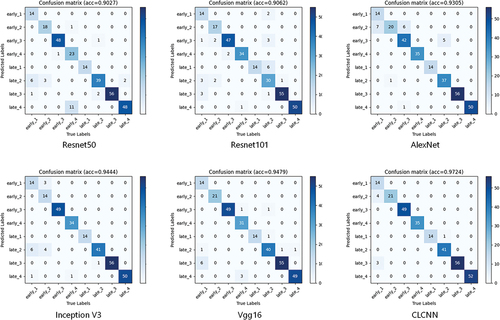
Figure 7. Accuracy curves for training and testing of each model.
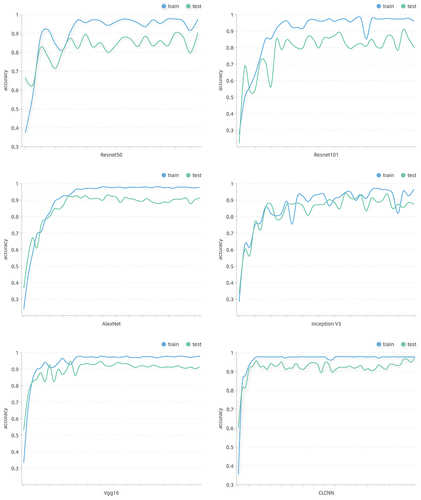
Table 7. The highest accuracy of the 6 models on test set.
Figure 8. The highest accuracy of CLCNN on different hyperparameters. lr denotes learn_rate. refers to EquationEquation 13
(13)
(13) .
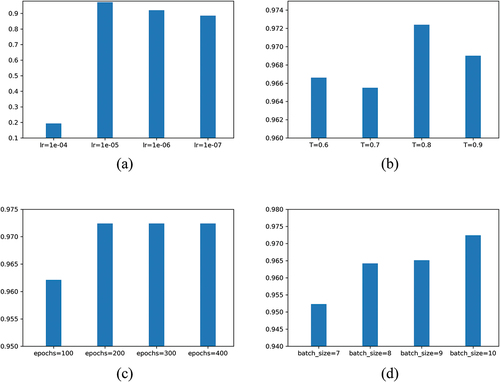
Table 8. Precision, recall, specificity, and F1 score of Vgg16 and CLCNN in each period.