Figures & data
Figure 1. Construction principles of SC IoT-oriented EIS.
Figure 2. Synthesis of SC IoT-oriented EIS.
Table 1. SC IoT-oriented EIS model.
Figure 3. Entropy flowchart.
Figure 4. Reliability test results of SC IoT-oriented EIS.
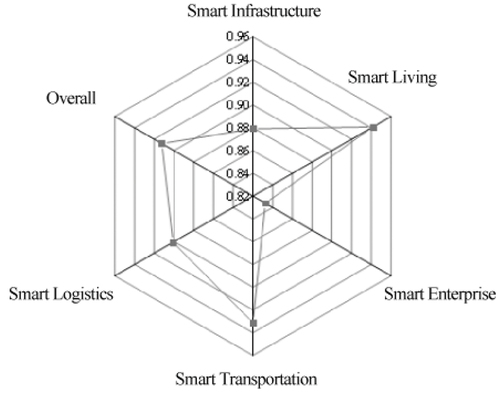
Figure 5. Entropy e arrangement.
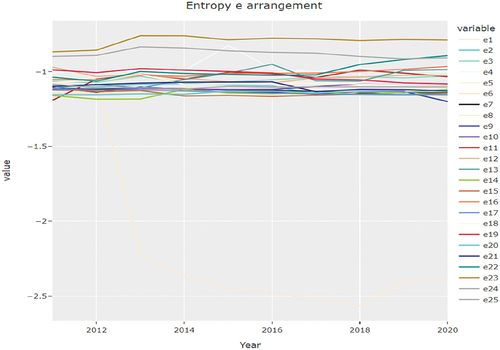
Figure 6. Difference coefficient g arrangement.
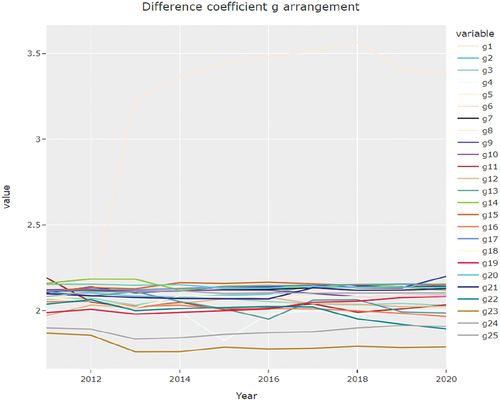
Figure 7. Weight W arrangement.
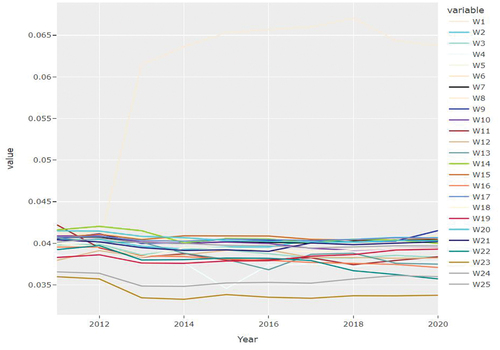
Figure 8. Smart infrastructure level from 2011–2020 in 31 cities.
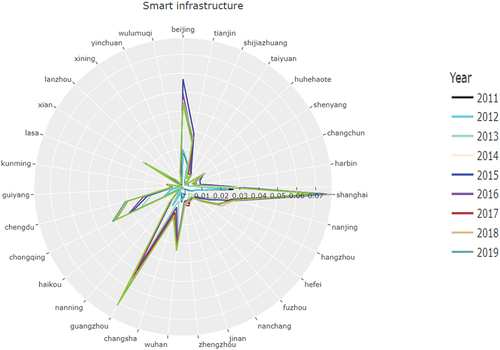
Figure 9. Smart living level from 2011–2020 in 31 cities.
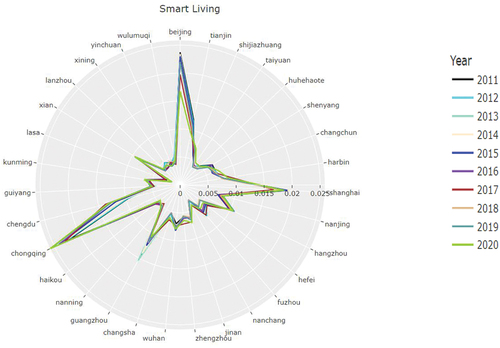
Figure 10. Smart enterprise level from 2011–2020 in 31 cities.
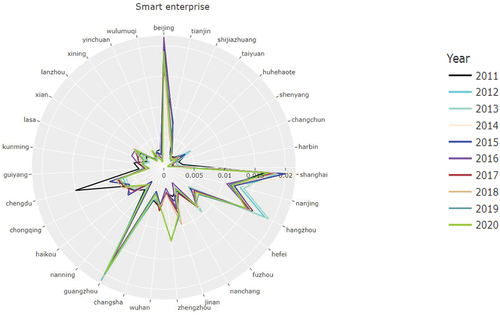
Figure 11. Smart transportation level from 2011–2020 in 31 cities.
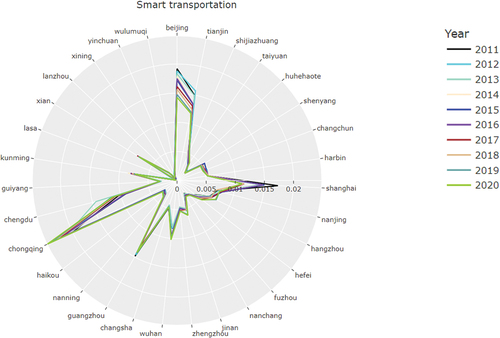
Figure 12. Smart logistics level from 2011–2020 in 31 cities.
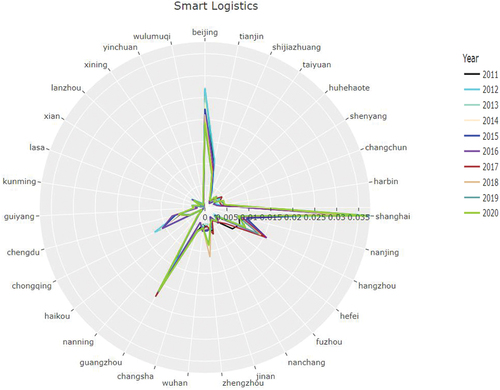
Figure 13. Development level of first-class indicators of smart city in 2011.
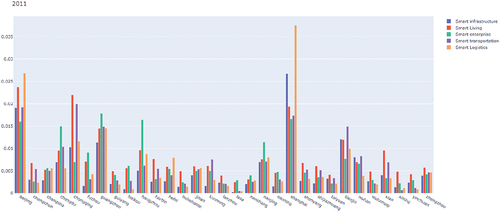
Figure 14. Development level of first-class indicators of smart city in 2015.
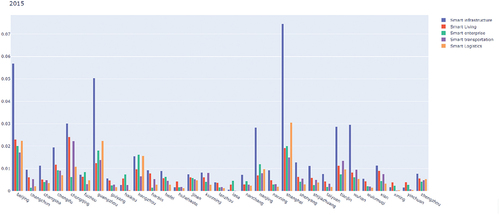
Figure 15. Development level of first-class indicators of smart city in 2020.
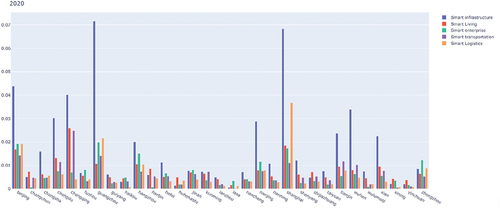
Figure 16. Smart city level in 2011.
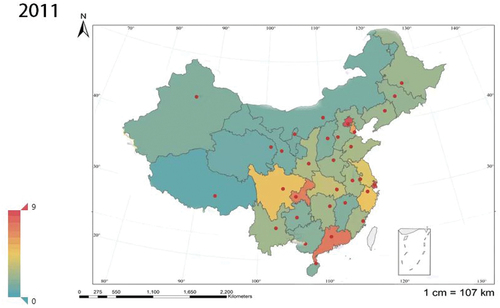
Figure 17. Smart city level in 2015.
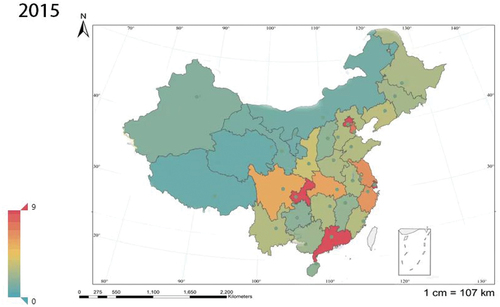
Figure 18. Smart city level in 2020.
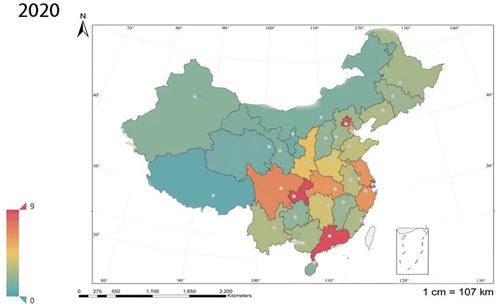
Figure 19. Capital input factors of IoT in smart city construction.
Table 2. Regression effect analysis of capital input factors.
Figure 20. Correlation analysis of capital input factors of IoT in smart city construction.
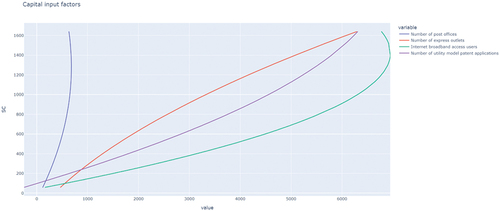
Figure 21. Comparative effect analysis of smart city capital input factors of IoT in different regions.
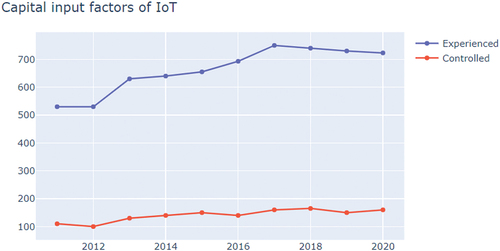
Figure 22. Labor l input factors of IoT in smart city construction.
Figure 23. Correlation analysis of labor input factors of IoT in smart city construction.
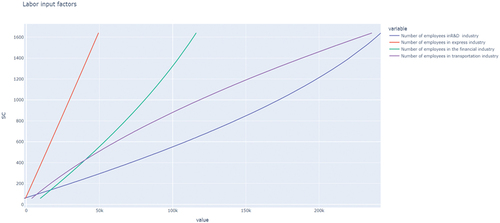
Figure 24. Comparative effect analysis of smart city labor input factors of IoT in different regions.
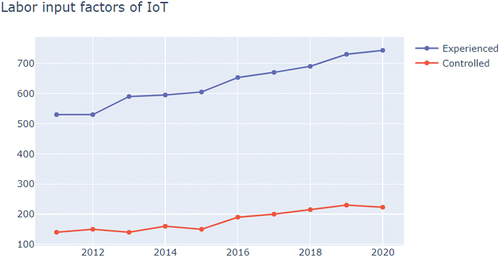
Figure 25. Output effect analysis of smart city construction model.
Figure 26. Correlation analysis of positive output of IoT in smart city construction.
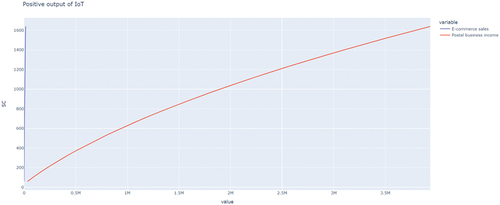
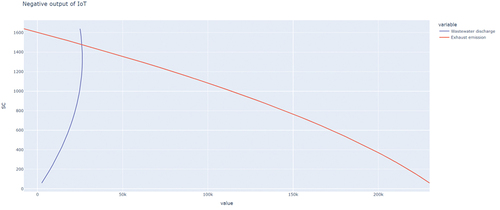
Figure 27. Correlation analysis of negative output of IoT in smart city construction.