
Figures & data
Figure 1. Structure of CNN-LSTM.
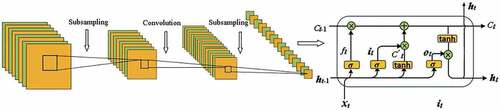
Figure 2. Prior measured and posterior temperatures from 2016 to 2020 simulated by CNN – LSTM.
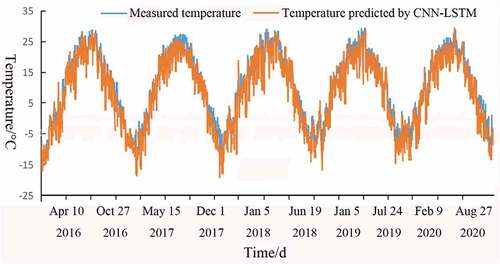
Figure 3. The distribution of the annual average temperature in 2016, measured (a) and simulated by the CNN-LSTM (b).
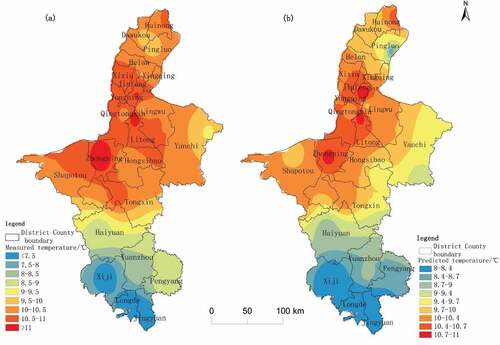
Figure 4. Curves of the observed and simulated annual average temperatures in 2016 at 25 stations in Ningxia.
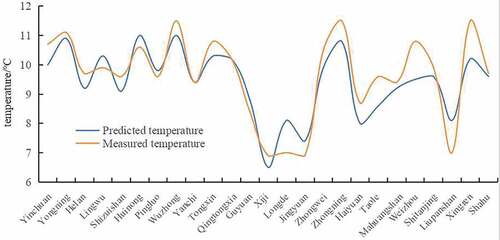
Figure 5. Spatial distribution of R2 between the measured and the simulated temperatures in 2016, as obtained by the CNN (a), LSTM (b), and CNN-LSTM (c).
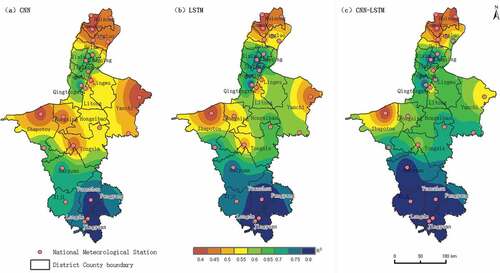
Figure 6. Distributions of R2 of the monthly mean temperatures in January (a), April (b), July (c), and October (d) in 2016, as simulated by the CNN-LSTM.
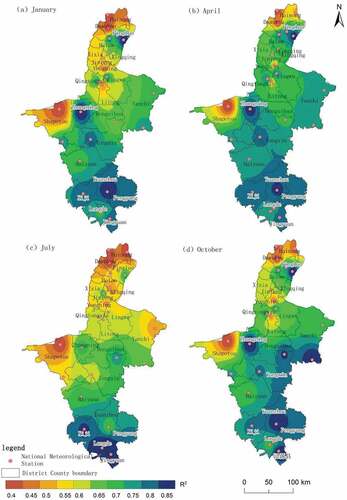
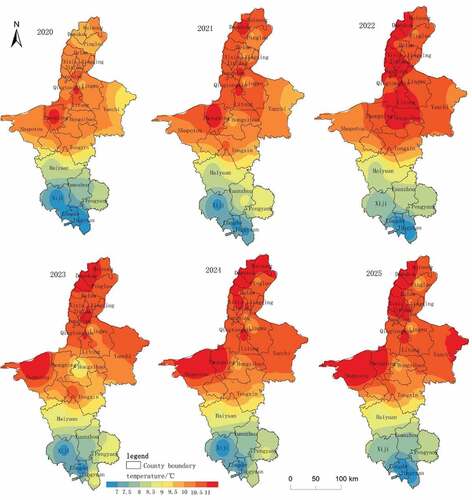
Figure 7. Spatial distributions of the annual average temperatures from 2021 to 2025 in Ningxia, as predicted by the CNN-LSTM according to the annual average temperature in the base year of 2020.
Data Availability Statement
Dataset(s) derived from public resources and made available with the article. The datasets analyzed during the current study are available in the [the National Oceanic and Atmospheric Administration (NOAA) of the United States] repository. These datasets were derived from the following public domain resources: [https://psl.noaa.gov/data/gridded/tables/temperature.html; ftp://ftp.ncdc.noaa.gov/pub/data/noaa/isd-lite/]