
Figures & data
Figure 1. The flowchart of the control system structure.
Figure 2. Directed interaction graph.
Figure 3. The trajectories of ,
,
,
and
.
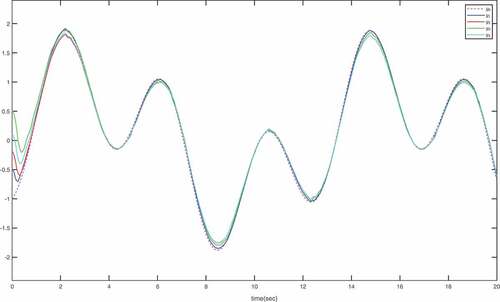
Figure 4. The curves of the tracking errors .
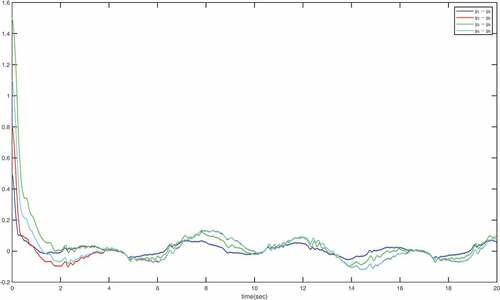
Figure 5. The trajectories of the system states with constraints.
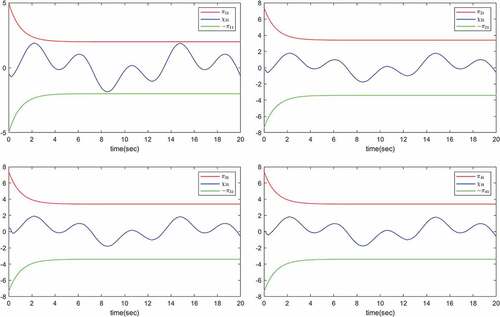
Figure 6. The trajectories of the error variables with constraints.
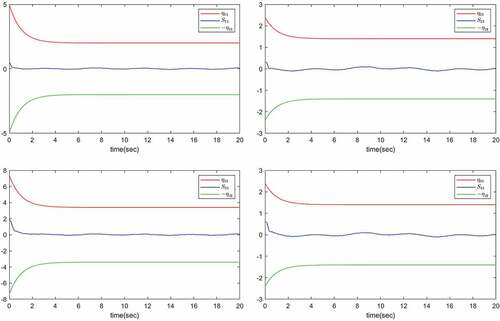
Figure 7. The trajectories of the system states and its estimation
.
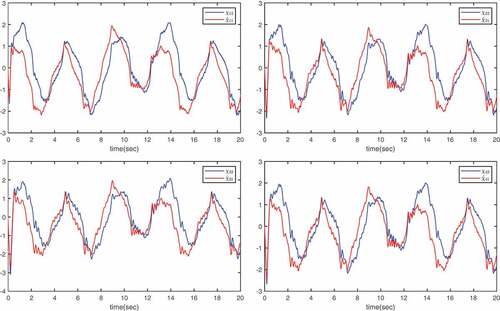
Figure 8. The curves of the controller and its saturation input
.
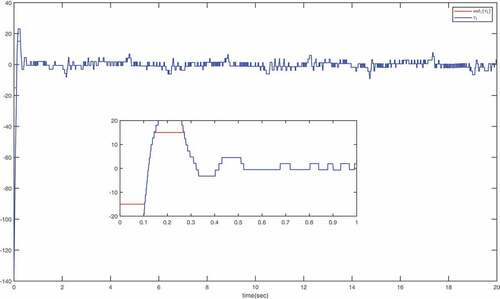
Figure 9. The curves of the controller and its saturation input
.
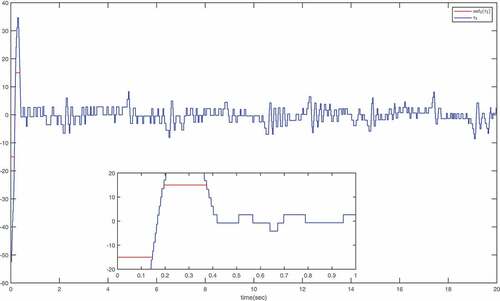
Figure 10. The curves of the controller and its saturation input
.
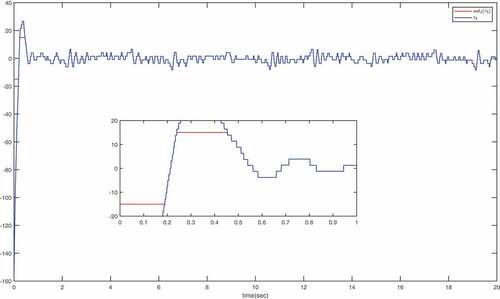
Figure 11. The curves of the controller and its saturation input
.
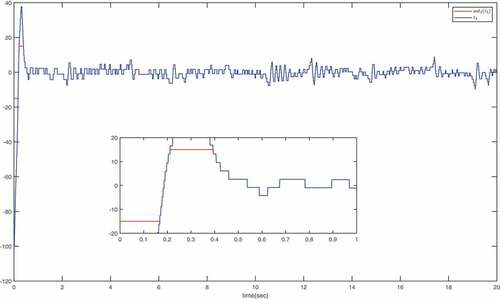
Figure 12. The inter-event time of .
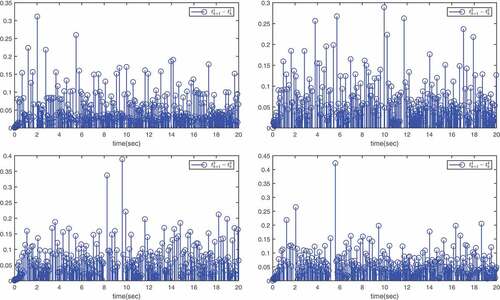
Figure 13. The trajectories of ,
,
,
and
with ETC scheme proposed in Yang et al. (Citation2022).
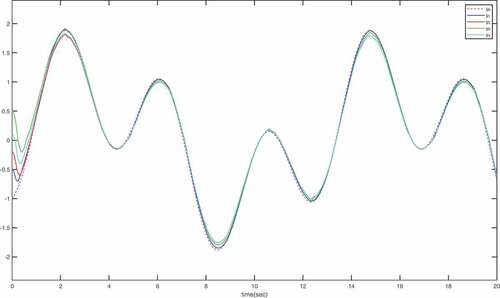
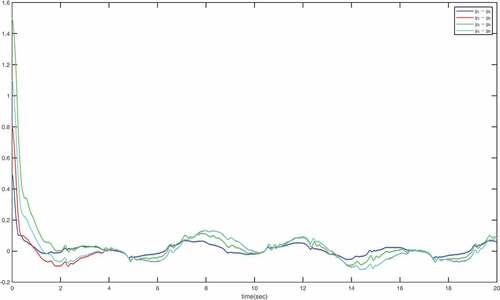
Table 1. Trigger numbers for agents.
Data availability statement
Data sharing is not applicable to this article as no new data were created or analyzed in this study.