Figures & data
Figure 1. A brief overview of the TP-GAN model architecture. modifications have been made to the existing TP-GAN model to produce this architecture. The generator network that combines a two-pathway layout (local and global pathways) and a discriminator with a single deep neural structure, followed by a light-CNN model, determines the accuracy of identity-preserving properties.
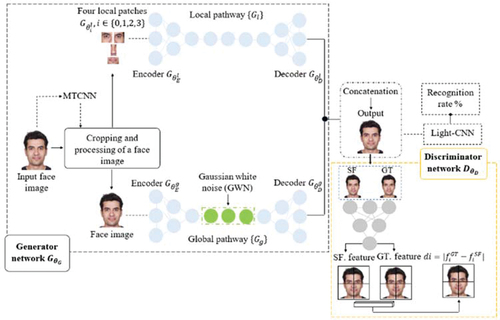
Figure 2. Overview of our approach to modifying the TP-GAN network. where
and
represent the decision node and leaf node, respectively. each decision node/leaf is implemented by a deep neural network (DNN) structure. our forest consist of
trees with
depth levels (i.e.
. arrows represent paths used to route information of the sample
along a tree to reach leaf
, which has probability
.
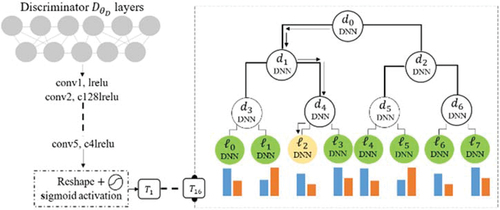
Figure 3. Comparison of our method’s generated facial images with those generated by TP-GAN on the multi-PIE database. despite significant abnormalities in the faces image, our synthetic faces seem convincing. The dataset was downloaded from the TP-GAN GitHub repository at: https://github.com/HRLTY/TP-GAN.
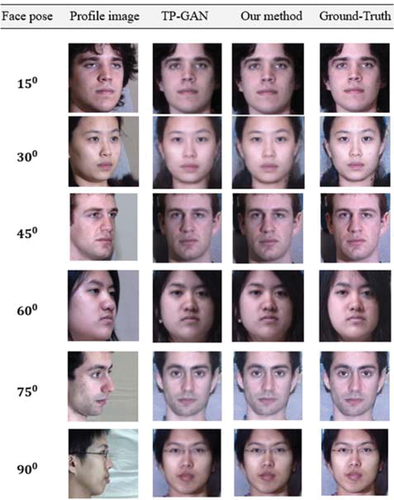
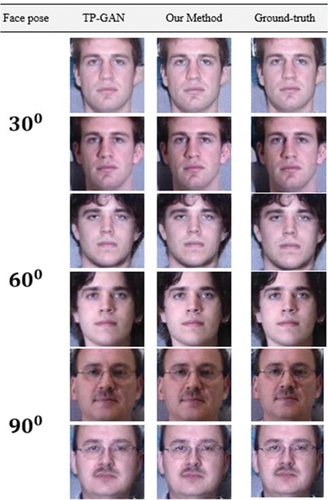
Figure 4. Comparison of our method's generated facial images with those generated by TP-GAN on the FEI database. Our method consistently produced better texture detail for all face poses. We downloaded the dataset from the FEI official repository at: https://fei.edu.br/~cet/facedatabase.html.
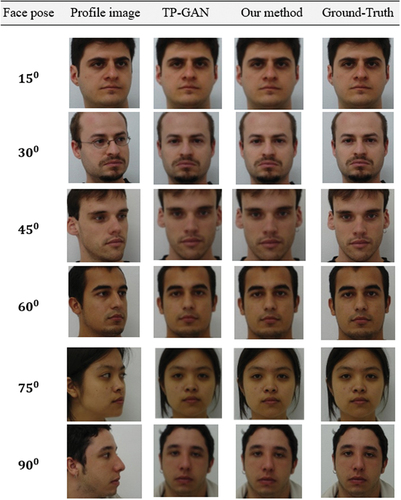
Figure 5. Comparison of our method's generated facial images with those generated by TP-GAN on the CAS-PEAL database. Despite illumination variations such as grey faces, our method consistently produced better texture detail. We downloaded the dataset from CAS-PEAL official repository at: https://github.com/YuYin1/DA-GAN.
Figure 6. A comparison of our frontal-profile synthesis results with those from various methods in the Multi-PIE dataset, using 30° and 45° face poses. We downloaded the dataset from the TP-GAN GitHub repository at: https://github.com/HRLTY/TP-GAN.
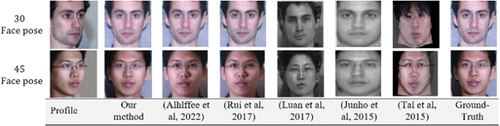
Figure 7. A comparison of our frontal-profile synthesis results with those generated on Multi-PIE dataset, using various face poses. We downloaded the dataset from the TP-GAN GitHub repository at: https://github.com/HRLTY/TP-GAN.
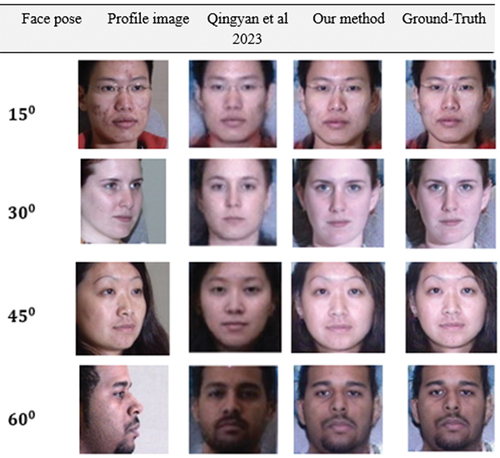
Figure 8. A comparison of our frontal-profile synthesis results with those generated on Multi-PIE dataset, using various face poses. We downloaded the dataset from the TP-GAN GitHub repository at: https://github.com/HRLTY/TP-GAN.
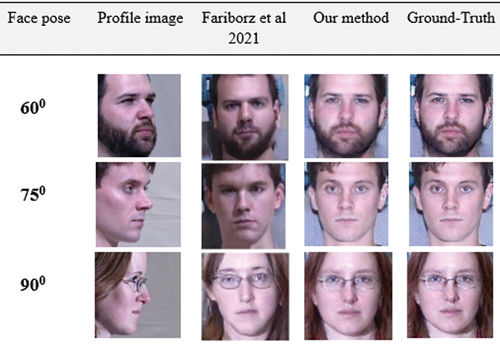
Figure 9. Our frontal-profile synthesis results have been compared with those obtained from various methods using 15°, 30° and 45° face poses from the CAS-PEAL dataset. We downloaded the dataset from CAS-PEAL official repository at: https://github.com/YuYin1/DA-GAN.
Figure 10. Comparing our frontal-profile synthesis results with those from other methods in the FEI dataset, using 30, 75 and 90 degree face poses. The dataset was downloaded from FEI official repository at https://fei.edu.br/~cet/facedatabase.html.
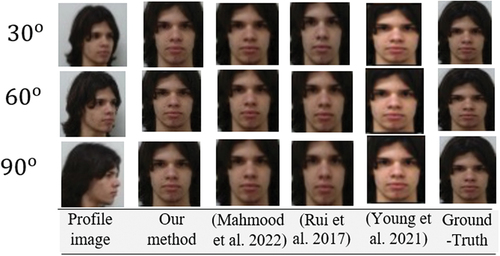
Table 1. Comparing our approach recognition rate against various methods on multi-PIE dataset. Despite the large poses, rank-1 recognition was achieved in almost all of the face poses.
Table 2. Comparing our approach recognition rate against various methods on CAS-PEAL dataset. Despite the large poses, rank-1 recognition was achieved in almost all of the face poses.
Table 3. A comparison of deep learning frameworks that focus on systemic details. Each deep learning model was tested on the same computer, but with different environment settings.
Figure 11. An overview of the training procedure steps for decision trees and forests.
Table 4. The amount of data augmentation that TP-GAN model synthesizes for each dataset. During the entire process, three datasets are used: training and testing.
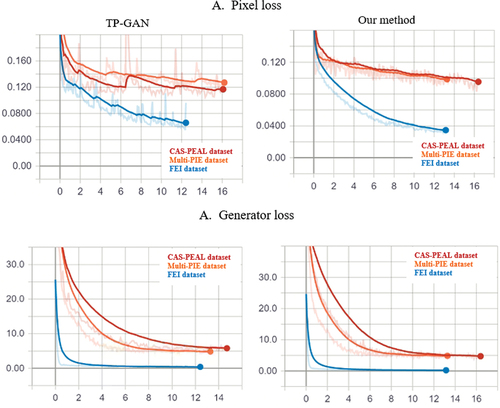
Figure 12. Plots of the TP-GAN and our method loss curves on the multi-PIE, FEI and CAS-PEAL datasets. Pixel loss is shown on A, while generator loss is shown on B. An axis in the horizontal direction indicates the number of epochs, or the number of times that all of the training data has been trained. The vertical axis indicates the accuracy of the model after each epoch; the smaller the loss, the better it performs.
Table
Figure 13. Examples of illumination levels on the multi-PIE dataset. For instance, illumination is a combination of brightness, exposure, contrast, and shadows. Various effects of quality can also be observed, including sharpness, smoothness, and blurriness. Overall, those qualities can contribute to a low level of face recognition. We downloaded the dataset from the TP-GAN GitHub repository at https://github.com/HRLTY/TP-GAN.