Figures & data
Figure 1. Process of Email Reply Suggestions (adopted from Strope and Kurzweil Citation2017).
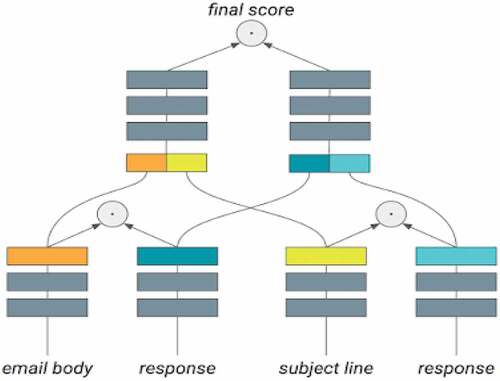
Table 1. Distribution Frequencies of the Study Sample according to Variables.
Table 2. Coefficients of Cronbach’s Alpha and Test-retest (Pearson).
Figure 2. Means and Standard Deviations of Responses.
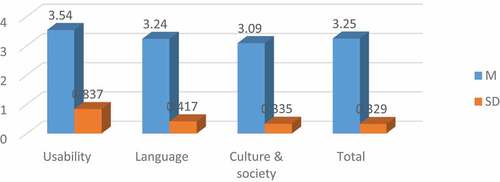
Table 3. Descriptive Statistics.
Table 4. Variance Analysis of Responses according to Job.
Table 5. Multiple Comparisons - Scheffe.
Table 6. T-Test Analysis of Responses according to Specialization.
Table 7. Variance Analysis of Responses according to Age.
Table 8. Multiple Comparisons - Scheffe.
Table 9. T-test Analysis of Responses according to Gender.
Table 10. Pearson Correlation between Usability and Language.
Table 11. Pearson Correlation between Usability, and Culture and Society.
Figure 3. Use categories of e-mail reply suggestions.
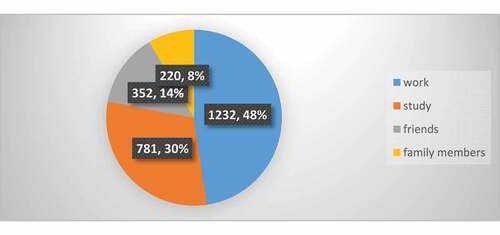
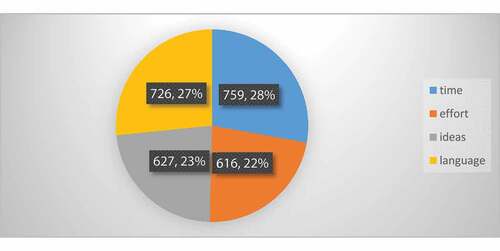
Figure 4. Useful Perspectives of E-mail Reply Suggestions.